July - September 2003
July - September 2003 |
||||||||
|
|
||||||||
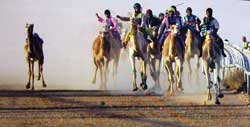
This study demonstrated that GIS can be used for studying camels in this region. Information about camels in the UAE has become very important, especially after the establishment of the Emirates Camel Racing Federation in 1992. The federation has made camel racing a more prestigious sport and has been directly or indirectly responsible for a growing appreciation of camels. A pilot study was conducted in Al Ain, a region in the eastern portion of the UAE located between latitude 23° 03' and 24° 40'North and longitude 55° 05' and 55° 53' East. No proper spatial database showing the locations of camel stables in relation to roads, valleys, racetracks, veterinary clinics, and fodder farms exists for this region. Analysis of this data could be used to help understand the relationships between these stables and related camel facilities, manage these facilities, and provide a better understanding of socioeconomic development in this area. Currently, the Al Ain Department of Agriculture and Animal Resources inspects the distribution of camels and their facilities by manually overlaying maps. This procedure is subject to errors, time-consuming, and tedious, and data cannot be reused efficiently. Because GIS and spatial analysis were considered suitable tools for this task, a GIS database was built that included main roads in the region, stables, water filling stations, valleys, fodder farms, veterinary clinics, and racetracks.
Data was collected from various departments involved in camel activities such as the Ain Municipality, Al Ain Department of Agriculture and Animal Resources, and the Camel Racing Federation. A Magellan GPS receiver was used to locate camel stables. The steps followed in building the camel database included data collection, geographic data digitization, topology creation, feature accuracy verification, transformation of feature locations to real-world coordinates, attribute database preparation, and linking geographic data with attribute data. Attribute data descriptions for each feature are listed in Table 1. Adobe Photoshop, ArcView 3.2, the ArcView Network Analyst extension, and Microsoft Access were used to prepare data. Spatial analysis was used to quantify the relationship between the distribution of camels and factors conducive to camel husbandry. Study MethodologyBuffering, point-in-polygon analysis, and network analysis were used to understand the spatial distribution of camels. Avenue scripts supplied custom drop-down menus that allowed users to interactively perform the analysis. Using GIS for camel analysis proved a very satisfying experience, owing to the ease of data manipulation, analysis, and display. However, the study faced numerous problems. In particular, identifying stables proved difficult because of their location among high sand dunes. One of the lessons learned from the project was that analysis can be improved by using a questionnaire to capture social information. Also hard-copy maps in Arabic are useful in convincing ordinary people of the viability of GIS. Through these maps, members of the local community learned the location of camel facilities in relation to their camels, which allowed optimum routing to these facilities. Consequently, they can now operate more efficiently and manage resources more economically. Study ResultsResults of the study revealed that camels in the UAE were found clustered near racetracks and roads rather than at locations with sources of water and grazing areas. Such clustering is unique among countries in the Middle East and North Africa. This clustering is the product of social and economic factors related to camel racing. With prizes as much as US$3 million, camel racing in the UAE can bestow both prestige and economic benefit to successful owners. Through the study, the role of GIS was demonstrated to local users. The key feature is that it greatly reduces the time spent in analysis and map preparation. The project helped change people's perception about the capabilities and potential use of GIS for studying camel population distribution. Future work will focus on tracking the movements of camels during a race using special GPS tracking collars. The positions of camels can then be stored in spreadsheets either as text (.txt) or database (.dbf) files and imported into ArcView Tracking Analyst. An Internet-based GIS system that allows camel owners to access the database anywhere, any time using mobile phones with GPS receivers and Wireless Application Protocol (WAP) is on its way. For more information on this project, contact AcknowledgmentThe author thanks the Esri office in the UAE (GISTEC) for its great support and cooperation. About the AuthorM.M. Yagoub, Ph.D., is an assistant professor in the Department of Geography at United Arab Emirates University and head of the committee for establishing the M.Sc. program in remote sensing and GIS at the university. He has been involved in geoinformation science since 1991. His interest is in the application of remote sensing and GIS for conservation of the oases and camels. More information on his work can be found online at faculty.uaeu.ac.ae/~myagou. Table 1: Attributes of camel facilities
|