Frequently research and technology endeavors have unforeseen but positive outcomes. When European explorers set out to find a shortcut to India, they discovered the New World. When a staphylococci bacteria culture was mistakenly contaminated with a common mold, the clear area between the mold and the bacterial colony led to the conclusion that the mold, Penicillin notatum, produced a compound that inhibited the growth of bacteria. This chance discovery led to the development of the antibiotic penicillin.
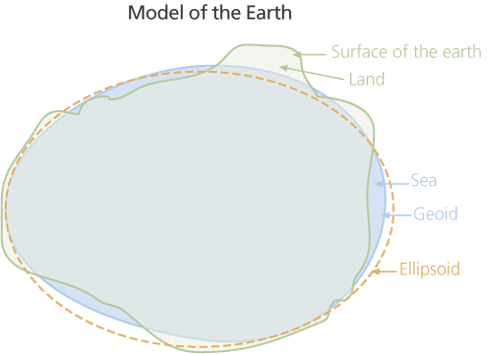
That the earth does not have a geometrically perfect shape is well established, and the geoid is used to describe the unique and irregular shape of the earth. However, only recently have the more substantial irregularities in the surface created by the global mean sea level (MSL) been observed. These irregularities are an order of magnitude greater than experts had predicted. Controlled by the gravitational potential of the earth, these irregularities form very gentle but massive “hills” and “valleys.” This astonishing finding was made possible through the use of GPS, a technology designed by the United States Department of Defense to revolutionize navigation for the U.S. Navy and Air Force. GPS has done that—and a lot more.
What Is Mean Sea Level?
For generations, the only way to express topographic or bathymetric elevation was to relate it to sea level. Geodesists once believed that the sea was in balance with the earth’s gravity and formed a perfectly regular figure. MSL is usually described as a tidal datum that is the arithmetic mean of hourly water elevations observed over a specific 19-year cycle. This definition averages out tidal highs and lows caused by the changing effects of the gravitational forces from the moon and sun.
MSL is defined as the zero elevation for a local area. The zero surface referenced by elevation is called a vertical datum. Unfortunately for mapmakers, sea level is not a simple surface. Since the sea surface conforms to the earth’s gravitational field, MSL also has slight hills and valleys that are similar to the land surface but much smoother. However, zero elevation as defined by Spain is not the same zero elevation defined by Canada, which is why locally defined vertical datums differ from each other.
The MSL surface is in a state of gravitational equilibrium. It can be regarded as extending under the continents and is a close approximation of the geoid. By definition, the geoid describes the irregular shape of the earth and is the true zero surface for measuring elevations. Because the geoid surface cannot be directly observed, heights above or below the geoid surface can’t be directly measured and are inferred by making gravity measurements and modeling the surface mathematically. Previously, there was no way to accurately measure the geoid so it was roughly approximated by MSL. Although for practical purposes, at the coastline the geoid and MSL surfaces are assumed to be essentially the same, at some spots the geoid can actually differ from MSL by several meters.
Differing Measurements
GPS has transformed how altitude at any spot is measured. GPS uses an ellipsoid coordinate system for both its horizontal and vertical datums. An ellipsoid—or flattened sphere—is used to represent the geometric model of the earth.

Conceptually, this precisely calculated ellipsoid, called an oblate ellipsoid of revolution, was intended to replicate the MSL as the main geodetic reference or vertical datum. If this ellipsoid vertical datum is used, height above the ellipsoid will not be the same as MSL and direct elevation readings for most locations will be embarrassingly off. This is caused, in part, because the GPS definition of altitude does not refer to MSL, but rather to a gravitational surface called the reference ellipsoid. Because the reference ellipsoid was intended to closely approximate the MSL, it was surprising when the two figures differed greatly.
The TOPEX/POSEIDON satellite, launched in 1992, was specifically designed to perform very precise altimetric observations. These measurements have demonstrated that neither human error nor GPS inaccuracies are responsible for the sometimes substantial discrepancies between ellipsoid and MSL measurements. In fact, the three-dimensional surface created by the earth’s sea level is not geometrically correct, and its significant irregularities could not be mathematically calculated; this explains the difference between the ellipsoid-based GPS elevation readings and elevations shown on accurate topographic maps.
A brief examination of elevation readings for Esri headquarters in Redlands, California, demonstrates these differences. The campus elevation is shown on topographic quadrangle maps and high-resolution digital elevation models (DEMs) for the area as approximately 400 meters above MSL. However, a precise, nonadjusted GPS reading for the same location typically shows the elevation as 368 meters.
Why is there a 32-meter difference? The GPS receiver uses a theoretical sea level estimated by a World Geodetic System (WGS84) ellipsoid, which does not perfectly follow the theoretical MSL. The MSL, approximated by an ellipsoid, is related to gravity or the center of mass of the earth. Discrepancies between a WGS84 ellipsoid, and the geoid vary with location. To continue with this example, elevation readings for Yucaipa, a city located less than 10 miles east of Redlands, differ by 31.5 meters.
The geoid and ellipsoid intersect at the geoid undulations. Undulations result from several phenomena, the most significant of which is the existence of gravitational anomalies caused by the nonhomogeneous nature of the earth. The density of magma in the earth’s crust is unevenly distributed. In areas of greater density, it can be significantly higher and, consequently, cooler. Less dense areas are correspondingly lower and hotter. Dense magma exerts a stronger pull, which causes the accumulation of water masses. Not much is known about whether these volumes relocate or how fast they move. If these locations do move, their movement would be at the same pace as other geologic events (i.e., extremely slow).
Precise measurements taken from space are applied to GPS readings. These measurements are based on an ellipsoid surface that is a mathematically generated model of the earth obtained from a three-dimensional Cartesian coordinate system. The GPS receivers can provide only the ellipsoid (geometric) height.
However, most users expect accurate elevation readings that are related to MSL. Consequently, newer GPS devices output orthometric (geoid) height measurements as a product of “behind the scenes” calculations based on a combination of formulas, tables, and matrices that use geographic coordinates as inputs. The appropriate height for the geographic location taken from a coarse or fine DEM matrix is provided instead of a real measurement of the z value (or height). Some receivers use approximations of the geoid height to estimate the orthometric height from the ellipsoid height. Still other units, based on an older technology, provide direct readings of the z value based on the ellipsoid.
A Globally Defined Geoid—Geoid99
A globally defined geoid was required so that GPS receivers could calculate the correct z value needed as a reference surface for a global vertical datum. Geoid99, a model with a submeter level of accuracy, was developed by the National Geodetic Survey. It is used as a zero surface to establish consistent and accurate elevations worldwide. However, despite this impressive level of accuracy, portions of the Geoid99 deviate from MSL due to gravity effects.
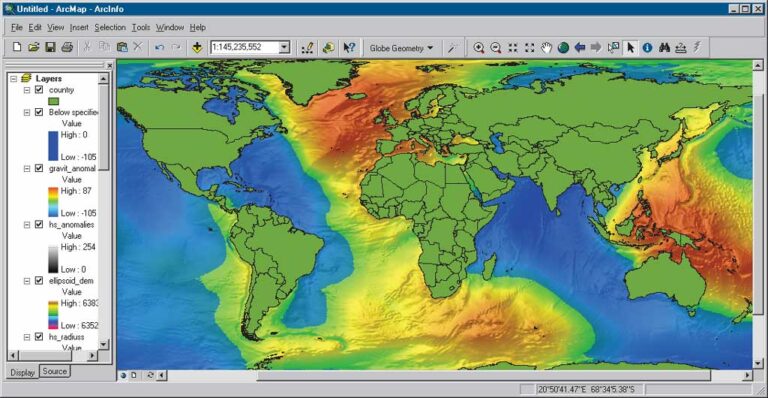
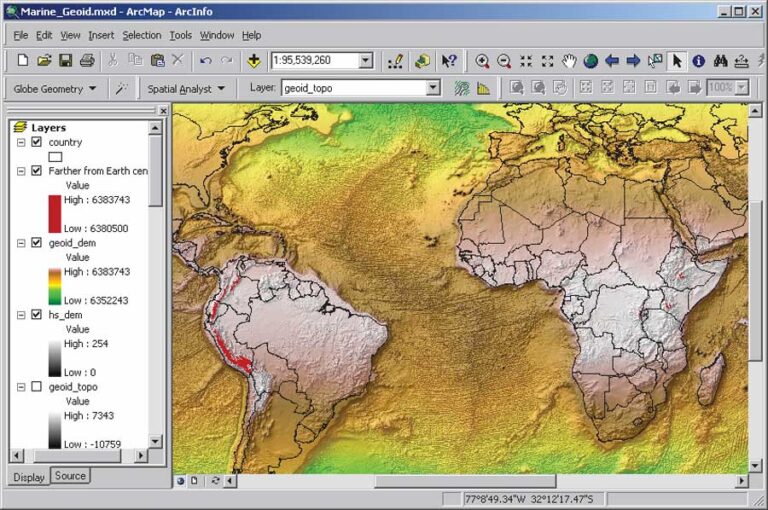
The Earth Geodetic Model (EGM96), developed in a collaborative effort by NASA Goddard Space Flight Center, the National Imagery and Mapping Agency (NIMA), and Ohio State University, has been used to compute geoid undulations accurate to better than one meter (except in areas lacking accurate surface gravity data). The values of this surface show at every location how much MSL varies from the ellipsoid used as the reference for GPS elevation readings. In other words, EGM96 shows how uneven the gravitational potential of the ocean’s surface really is. The maximum range of the Geoid99 undulations with respect to the WGS84 ellipsoid is 192 meters. The biggest anomaly was discovered southeast of India where the geoid is 105 meters below the ellipsoid, and its highest swelling was observed in eastern Indonesia.
“What If” Simulations
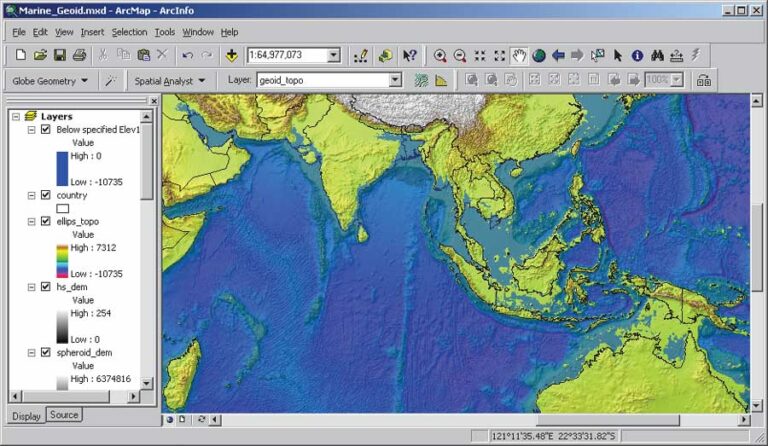
How would continental coastlines change if there were no gravitational anomalies? The short answer would be that they would appear the same as if the earth were an ellipsoid. The biggest undulations are concentrated in the northern Indian Ocean and within the Indonesian Archipelago. Consequently, areas currently covered by the Arafura Sea and Carpenteria Bay, both north of Australia, would emerge. Conversely other areas, such as the lowlands formed by the deltas of some of the main South Asian rivers such as the Ganges and Brahmaputra as well as those of Indus, Irrawaddy, and Mekong, would sink.
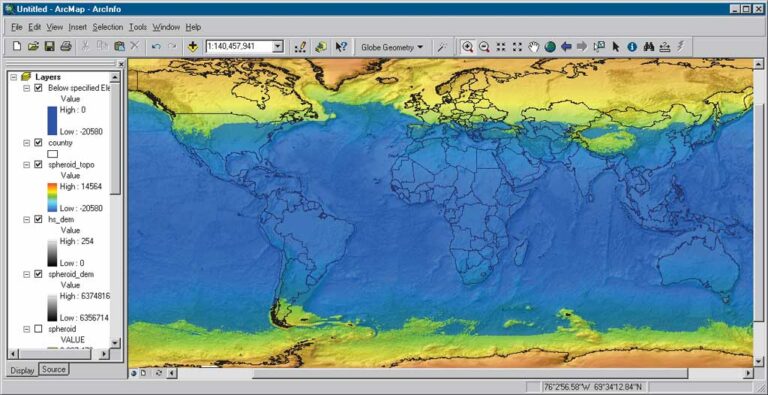
As an intellectual exercise, imagine for a moment that the earth has the geometrically perfect shape of a spheroid and then an ellipsoid. To visualize these “what if” scenarios, a computer simulation was generated using rasters that represented distances to the earth’s center and were generated with the Raster Calculator in the ArcGIS Spatial Analyst extension. A standard digital elevation model for the globe was modified by removing the gravitational anomalies identified by EGM96. These geometrically correct representations of a spheroid and ellipsoid were used to produce GIS simulations called the SPHEROID DEM and ELLIPSOID DEM. The accompanying illustrations show the effects these shapes, as well as other scenarios, have on the distribution of landmass and ocean.
SPHEROID DEM
The SPHEROID DEM was created based on the assumption that the earth’s shape, or more precisely, the shape of the earth’s surface as represented by MSL, is spherical. In other words, the globe’s radius connecting the center of mass with the hypothetical equipotential gravitational surface is identical everywhere on the planet. The radius was set to 6,367,473 meters, which is the distance to the earth’s center from the ellipsoidal reference surface at 45 degrees latitude.
This change in geometry to a spheroid geometry with its altered gravity would cause the global ocean to change. The polar zones would be relatively farther from the center of the earth, and these new higher altitudes would force seawater toward the equator. By the same token, the equatorial region would be relatively closer to the earth’s center and would be more strongly affected by gravity. Increased gravitational force in the equatorial zone would pull oceanic water toward the equator and form a global equatorial ocean.
ELLIPSOID DEM
The ELLIPSOID DEM depicts the earth as an ellipsoid. Although distances from the surface of an ellipsoid to the earth’s center along each latitude are identical, each latitude has its own unique value increasing from each pole toward the equator. To look at this ellipsoid earth from yet another perspective—its physical shape characterized by the distance of any point on the surface to the center of the earth’s mass—a grid was generated using the WGS84 datum definition. Each grid cell value represents the distance in meters from the surface to the earth’s center of mass. A complex combination of trigonometric functions was applied to create the representation of the ellipsoid. Then the DEM representing the earth’s current relief was added to the ellipsoid raster.
The difference between the major and minor axes of the WGS84 ellipsoid is 42,770 meters. The difference between the length of the radius at the equator and one of the poles is 21,385 meters—only 0.33 percent of the radius. The “flattening” of the earth is, geometrically speaking, relatively insignificant but in terms of geography, it has a tremendous impact.
If the Earth Stood Still
What would happen if the earth stopped spinning and the centrifugal effect ceased to force oceans to accumulate around the equator? It appears that the world’s ocean would split into two polar oceans and leave the equatorial area totally dry. To model this hypothesis, a value of 6,371,146 meters—the distance from the earth’s center indicates the approximate elevation of the sea level on the reference ellipsoid—was specified to separate water from land. For this “what if” simulation, the elevation of the sea level was based on the assumption that the volume of ocean water would be about the same as it is today.
Melting Glaciers

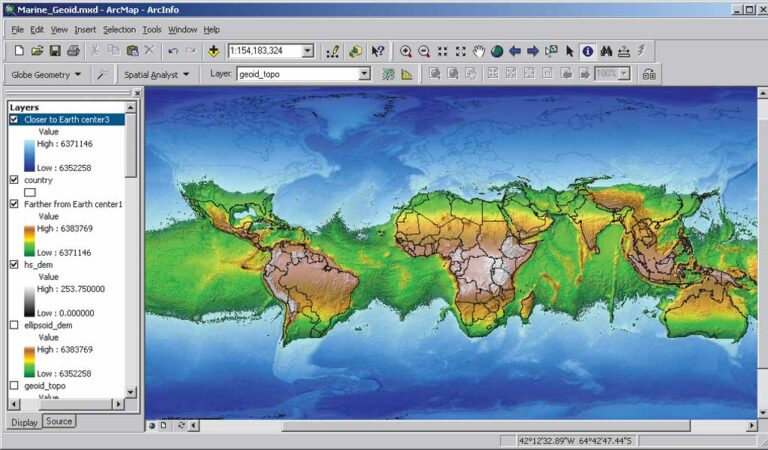
Returning to a geoid representation of the earth, one more simulation models an earth where all the glaciers have melted. This simulation might predict a future that is only a few hundred years distant if the large glaciers of Antarctica and Greenland, which currently cover approximately 10 percent of all land, melted as a result of global warming. If all the water in these glaciers were released, the MSL would rise about 80 meters above its current level.
Conclusion
GIS makes it possible to explore the effects of different conceptualizations of the earth’s shape and model a variety of global conditions.
Acknowledgments
The author would like to thank his colleagues—Melita Kennedy, Lenny Kneller, Corey LaMar, and Marcelo Villacres—for their significant contributions to this article.
About the author

