Spring 2008
Spring 2008 |
||||||||
|
|
||||||||
By using simple, relatively affordable technology, such as a commercial fish finder, along with ArcGIS extensions Spatial Analyst and 3D Analyst, WPC has captured data previously unavailable at this scale and level of detail. Integrating track information, which logs depth and latitude-longitude at a three-second interval, point shapefiles were exported that can be used to generate river depth rasters, bathymetric contour lines, and even three-dimensional flyovers that can be viewed in ArcScene or as an Audio Video Interleaved (AVI) file. The broad range of Esri tools allows data to be analyzed by experts, then easily disseminated to a broader, public audience. Study AreaThe Allegheny River's headwaters are in Potter County, Pennsylvania. The river then meanders 609.6 kilometers (381 miles) until it converges with the Monongahela River in Pittsburgh, Pennsylvania, to form the Ohio River. The watershed drains 29,876 square kilometers (11,580 square miles) of mostly rural land in the northern Allegheny Plateau. The Allegheny River watershed is the northernmost of all the Mississippi River watersheds. Portions of the upper Allegheny River (which is part of the Ohio River basin) hold some of the last remaining habitat for imperiled aquatic species. This project focused on the impounded section of the Allegheny River from Lock and Dam 9 in Rimer, Pennsylvania, south to Lock and Dam 4 in Natrona, Pennsylvania. This segment of the Allegheny River is managed by the U.S. Army Corps of Engineers (USACE) for commercial navigation purposes, which requires a minimum depth of 2.74 meters (9 feet). In 2005, approximately 2.1 million tons of commodities (i.e., farm products, sand and gravel, coal, petroleum products) were transported via the Allegheny River (Port of Pittsburgh, 2005). The Allegheny River is well known in the region as a source of tremendous recreational opportunity, but it also is heavily utilized for commercial purposes. Developing the System
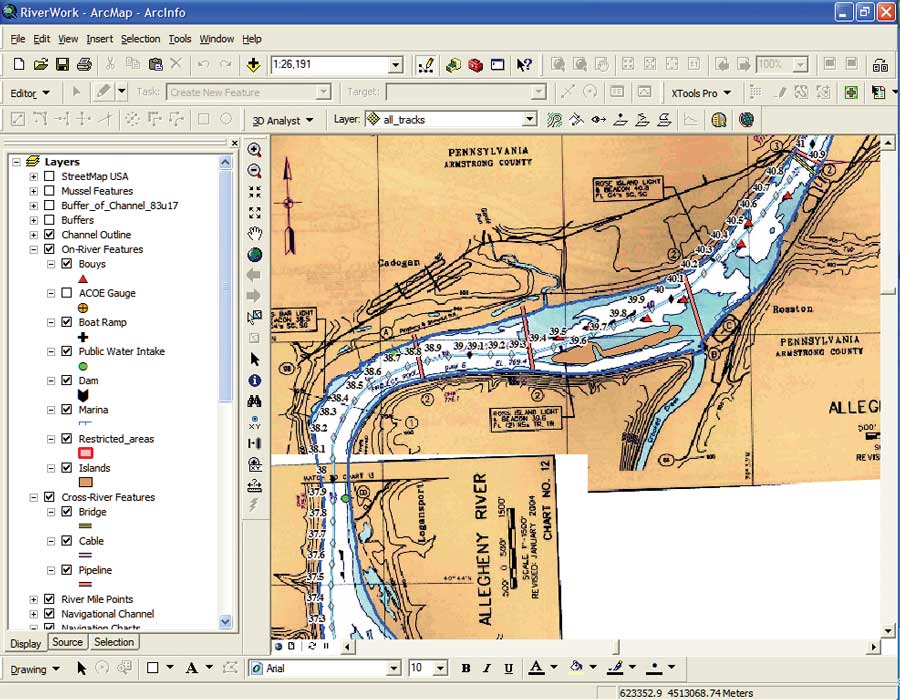
Despite the Allegheny River being a vital resource to the region, both economically and ecologically, little GIS-ready data is available to build a comprehensive system to manage the river. The best data source was the USACE Navigational Charts. These laminated and spiral-bound maps are designed as a reference for on-river information by boaters, specifically tugboats using the river for commercial navigation. The maps contain information on the sailing line (navigational channel), buoys, marinas, and lock and dam structures as well as underwater hazards such as pipelines and cables. Adjacent towns, bridges, notable features, and other landmarks are included to guide users as they travel up- or downriver. The first step WPC undertook was to scan and georeference these maps so they would line up with river orientation rather than left-to-right book format. Once that process was completed, all features on the map were digitized for future analysis. Any marina or on-river activity on the Allegheny River is usually referenced by river mile (RM), with RM 0 being the Point of Pittsburgh and commercial navigation ending at RM 69.5. The North American Datum 1983, Universal Transverse Mercator, Zone 17 North (NAD_1983_UTM_Zone_17N) coordinate system was used due to the study area's strong north�south trend. (This coordinate system is based on meters. All measurements in this article are listed in both metric and statute units.) One dataset of particular interest to WPC was bathymetry. While there had been depth surveys completed for Pennsylvania Department of Environmental Protection permit purposes, that data was very limited in scale and, for the most part, not available to the public. The USACE Navigational Charts also mapped river depth, but it was a rough boundary that indicated where it was safe to travel. There was no recent, accurate, or data-intensive bathymetry available for the Allegheny River. Survey MethodologyPrevious publications on bathymetry mapping for a variety of habitats ranging from small ponds to mapping coral reefs in Belize were reviewed. Methodologies similar to those found in Case Study: Mapping Half Moon Caye's Reef Using the Adaptive Bathymetric System (Ecochard et al., 2008) were ultimately the inspiration for this river mapping project. The methodology involved traversing a grid over the study area at very slow speeds, using a bathymetry measuring device to collect location and bathymetric data at a standard interval. The reference document described oceanic bathymetry data collection, so some manipulation was required. WPC's project would involve mapping a larger area that would be more linear than an easily chartable square. Survey passes were done up and down each shoreline at 25 percent and 75 percent of river width and combined with an S pattern pass downriver, enabling the creation of a grid that maximized both coverage and efficiency. In 2007, during these mapping efforts, 179,985 data points were collected. Using a tightly spaced survey method—50 meters (164.0 feet)—a dataset of depth points was built that could be interpolated to full study area coverage for each data collection day. Hardware/Software
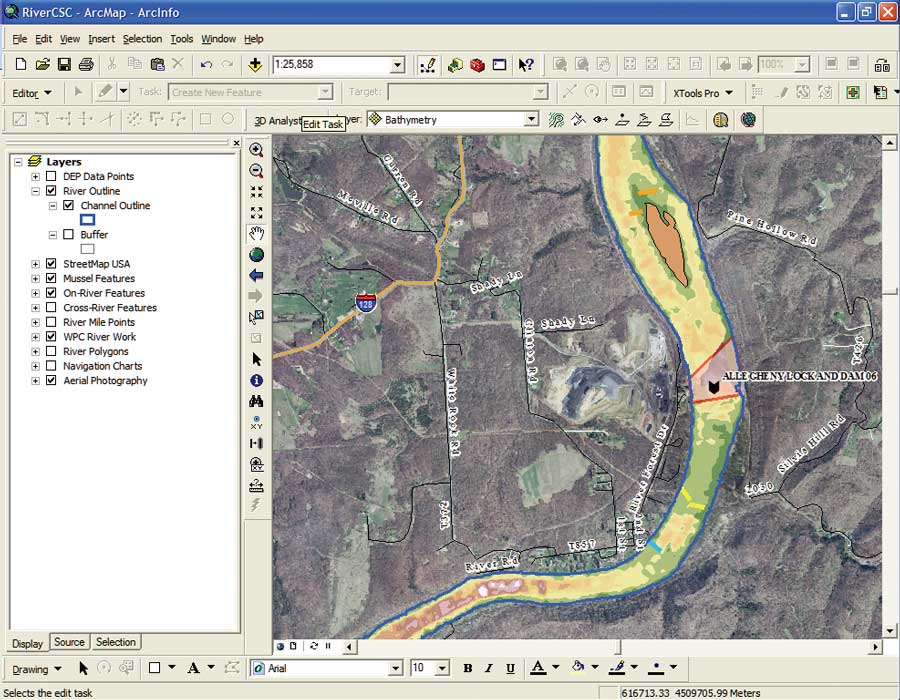
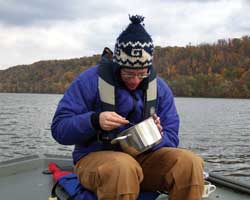
WPC's research vessel was equipped with a Garmin 498 GPSMAP, an off-the-shelf GPS/fish finder that supported transferring track data to a PC for further analysis. The fish finder was set to active track logging mode, which recorded data points at three-second intervals. Traveling at approximately 4.02 kilometers per hour (2.50 mph) ensured that sufficient data points were recorded to complete that study area without filling the unit's internal memory card. Recording the data in "active track" mode was essential, as once a track was saved to the memory card, the logged data was truncated, completely removing the depth attribute. Tracks were saved by individual field day in both a "raw" and "checked" format to ensure that the data could be back checked, group analyzed, and merged for full pool analysis. Data was transferred from the Garmin unit to a PC using Garmin's transfer cable and a software program called DNR Garmin. This free program, created by the Minnesota Department of Natural Resources (DNR), provides users with the ability to directly transfer data from Garmin GPS handheld receivers to various GIS software packages. The ability to export the data as projection-defined shapefiles made the extraction of field points for analysis with ArcGIS simple. GIS AnalysisThe point shapefiles were brought into ArcMap, where they were checked for locational and bathymetric accuracy. The ArcGIS Spatial Analyst extension's Interpolate To Raster tool with inverse distance weighting was used on this data. The Esri Web help and Esri staff were helpful in ensuring the analysis was a valid interpretation of the river bottom.
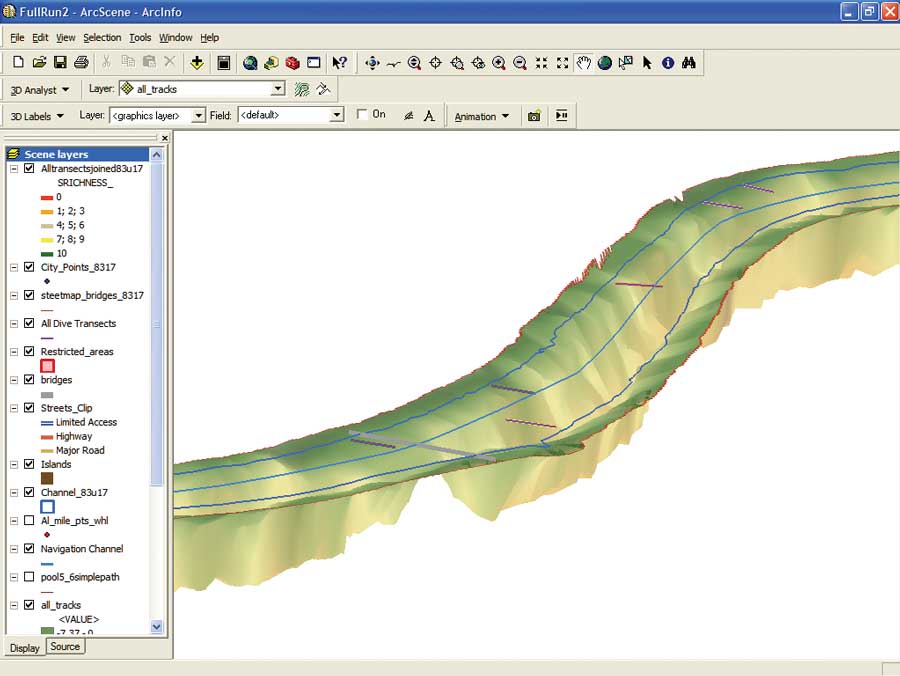
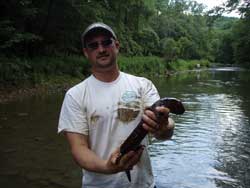
On the Inverse Distance Weighted dialog box, the Input Points were the points collected from the previous day's survey; the Z value field was set to DEPTH; and Power, which controls the significance of surrounding points on the interpolated value, was eventually set at 0.5 after experimentation with the default value of 2 as well as 0.1, 0.5, 3.5, and 4.5. The 0.5 value yielded the most accurate results. The Search radius type was set to Variable with the number of points set to the default value of 12 and the maximum distance to 70 meters (229.6 feet). Using this distance ensured there were no gaps in coverage while keeping the likelihood of error to a minimum. Barrier polylines were used to ensure that islands were not filled in and the raster did not extend beyond shoreline. Cell size was set at 5 meters by 5 meters (16.4 feet by 16.4 feet) to maintain data resolution without compromising data integrity. Once the raster had been created, contour lines were generated using any desired interval. Contours were easiest to read at intervals from 0.9 to 1.5 meters (3 to 5 feet). It was difficult to select a contour interval for the entire river, since the range of depths varied greatly across pools, from shallow areas of 0.40 meters (1.3 feet) to deep holes approaching 21.34 meters (70 feet). Another advantage of using Esri's ArcGIS to interpret the bathymetry data was the ability to use the ArcScene program in the ArcGIS 3D Analyst extension. Generating the bathymetry data as a negative value allows a user to create a triangulated irregular network (TIN). The bathymetry raster may then be draped over the generated TIN to show the intervals along with an exaggerated relief. This TIN, combined with a bird's-eye view flyover, with nearby towns and roads identified, was used to create a video for public outreach and education. WPC started mapping in the middle of the Lock and Dam sections at Pool 6 because WPC's Aquatic Science staff freshwater mussel surveys were being completed in that location. The survey was carried out using Scuba. Providing accurate, timely bathymetry data enabled WPC Aquatic Science staff to prioritize survey locations because freshwater mussels can thrive only at specific depths. Dive work provided a unique quality assurance/quality control (QA/QC) check for the data because the divers dove to the bottom of the river, offering a secondary—albeit nonconventional—data validation process and allowing for careful examination of the raster. A Smashing Success
In a single field season, WPC has completed bathymetric mapping of pools 4, 5, 6, 7, and 8 in the Allegheny River. WPC mapped 60.96 kilometers (38.1 river miles) in a mere 36 days, beginning in May 2007 and ending in mid-November 2007. The ability to map and analyze the river data in-house saved WPC an incredible amount of money, compared to using a consultant to acquire the data. This cost-effective and relatively simple method of bathymetry mapping will allow WPC to continue to remap target sections of the river to get an idea of how the river changes from year to year. Impacts could be the result of high flow conditions or could be from anthropogenic activities that are occurring below the visible surface. The bathymetry information WPC has collected will be used to prioritize further mussel survey locations and will be a vital part of the River Information System. Combined with river flow, the data can be used to model pollution concentrations, substrate shifts, and sediment deposition. The completed dataset will be a useful tool for a variety of end users from USACE to recreational boaters and academic researchers. With access to a dataset that was, until now, unavailable at this scale and level of detail, GIS users are limited only by their own creativity. What's to ComeWPC has been working to integrate additional datasets into the system as they become available. Contacts have been made across western Pennsylvania including universities, state and federal departments, and private corporations. All these partners have the potential to add value to the system as well as benefit from the data WPC has created. Having a research vessel will enable WPC to finish mapping the navigable portion of the Allegheny River in spring 2008 and move down to the Ohio River. There has been internal discussion of using this technology to map western Pennsylvania's glacial lakes, another ecologically important feature of the region's diverse geography. For a more detailed description of the project, contact Eli Long, GIS specialist, WPC, Freshwater Conservation Program, at elong@paconserve.org. AcknowledgmentsThe authors thank the Colcom Foundation for donating the funds necessary to procure the research vessel and associated mapping equipment. Without those funds, this project would not have been possible. ReferencesEcochard, J. B., W. D. Heyman, N. Requena, E. Cuevas, and F. B. Biasi, 2003. Case Study: Mapping Half Moon Caye's Reef Using the Adaptive Bathymetric System. The Nature Conservancy, Arlington, Virginia. Master, L. L., S. R. Flack, and B. A. Stein, eds., 1998. Rivers of Life: Critical Watersheds for Protecting Freshwater Biodiversity. The Nature Conservancy, Arlington, Virginia. Port of Pittsburgh Commission, 2005. Annual Report to the Legislature 2005. Taylor, B. R., and J. Helwig, 1995. "Submergent Macrophytes in a Cooling Pond in Alberta, Canada." Aquatic Botany, 51 (3/4):243�257. About the Authors
Eli Long has worked as a GIS specialist for WPC's Freshwater Conservation Program since its inception in 2001. He graduated from the Department of Geography and Regional Planning of the Indiana University of Pennsylvania in 2001 with dual degrees in cartography/GIS and environmental geography. An ArcView 3.2 user from his early years, Long taught himself ArcGIS and continues to attend GIS classes and training as often as possible. Besides conservation, Long is very interested in the geographies of food and beer and enjoys extensive research on both subjects. For more information on the river mapping project, contact him at elong@paconserve.org.
Eric J. Chapman has worked for WPC's Freshwater Conservation Program since December 2007 as the director of aquatic science. His primary responsibilities include supervising the river mapping project and a variety of other research projects in western Pennsylvania aquatic systems. Prior to his work at WPC, he was a research scientist for Montclair State University in Montclair, New Jersey, and City University of New York—Queens College and carried out research on freshwater and estuarine biodiversity. He holds a master's degree in environmental science from Montclair State University and a bachelor of science degree in biology from Indiana University of Pennsylvania, Indiana. He has several years of GIS experience, "but he truly only knows enough to be dangerous" according to Eli Long. For more information on the river mapping project, contact Chapman at echapman@paconserve.org. |