Spring 2008
Spring 2008 |
||||||||
|
|
||||||||
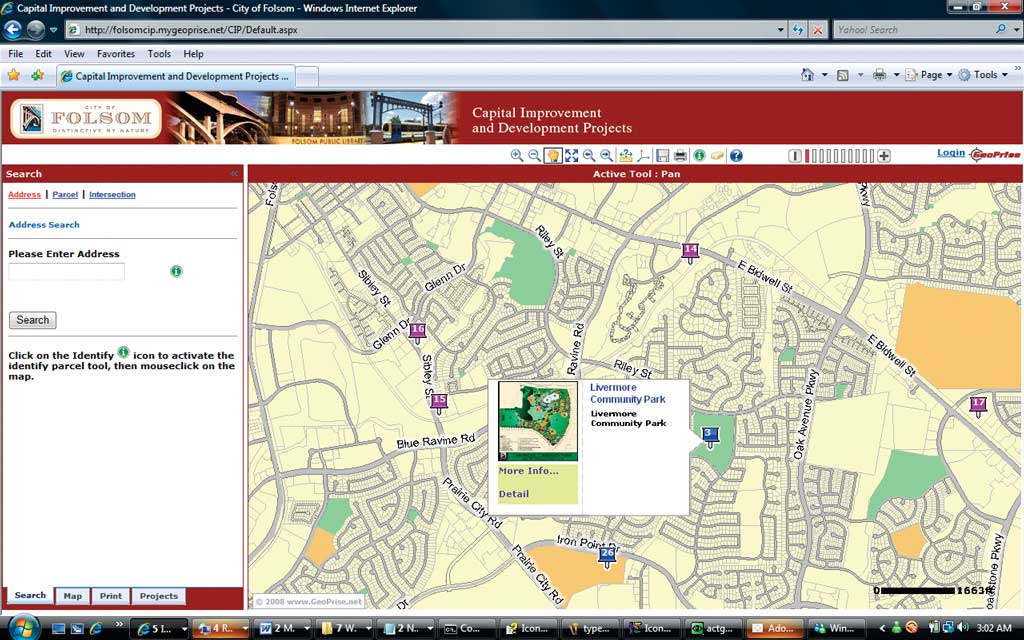
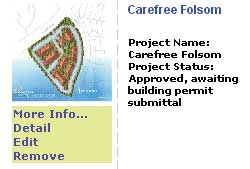
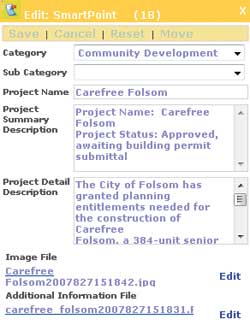
To inform the public of new services, warn citizens of possible project commuting impacts, and reduce staff time handling public inquiries, the city launched its first map-based Web site in November 2007. The site allows the public to quickly and easily view information about the city's capital improvement projects (CIP) and development projects. The ArcGIS Server-based solution, developed by Esri business partner GeoPrise, has helped the city enhance the quality of life by keeping citizens better informed while decreasing the amount of time city staff spend responding to public inquiries and ensuring they stay better focused performing essential daily services. Effectively and simply communicating project information was the most important design consideration for the project. Web site specifications required an application that was simple and intuitive to use and included common Web mapping features and tools. The application should also be visually attractive and integrate the color scheme and graphics used by the city's existing Web site. An additional goal was the creation of a simple interface that would allow individual department users to load and update project information in a secure environment. With limited programming staff and a tight deployment schedule, the city also sought a commercial off-the-shelf (COTS) solution that could be configured to meet the project's goals and eliminate a lengthy internal development cycle. The solution is based on ArcGIS Server and leverages its Service Oriented Architecture (SOA) and the Esri Web Application Developer Framework (ADF). The result is an extensible and flexible technology. The application user interface, developed with Microsoft .NET 2.0 and AJAX, is easy for the public to use and city staff to manage and customize. Intuitive mouse-over controls instantly display project development information in compact summary format. Additional mouse-over controls display project details, and embedded document retrieval functionality can display extensive information as pop-up PDF or multipage TIFF documents. Administrative wizards generate graphics and matching color schemes, creating a user interface that matches the city's existing Web site. The toolset is simple to use. The controls required to browse the site and retrieve development project data are available on the opening page. Checkboxes in the AJAX application panels allow users to quickly filter by department or project type. The always available tab sets ensure quick access to project filters, PDF printing templates, overview, and search tools. The Capitol Improvement and Development Projects Viewer project was completed in less than 90 days and was implemented in less than 30 days. The city worked with the consultants to create the map service, develop attributes supporting the search functions, compile the required development project data, and select appropriate color schemes and supporting header graphics. Previously, members of the public had to visit city hall to pick up hard-copy documents or search multiple department Web pages to find documents that described the schedule, funding, and updated status or furnished photos and diagrams of capital improvement and development projects. Users were trained to use the Web-based project administration deployment tools so that each department could post its own project data. The GIS department helped users refine the images used in the thumbnail project images, develop appropriate project details, and create supporting project description documents in an automated fashion. Information on new projects is entered using administrative logins right from the application interface. Once logged in, administrative users can edit existing projects by hovering over the project SmartPoint. A standard pop-up panel is displayed with additional links for editing project details and removing old projects. To enter a new project, the user zooms to the project map location, right-clicks on the map, and selects Add SmartPoint from the context menu.
The Add SmartPoint panel allows administrative users to select a department and category, name the new project, and enter a brief project description and a detailed description. Two browse options allow administrative users to select and upload a thumbnail project image and a detailed project PDF document that are saved to the server. Immediately the project is posted and available to end users. The CIP and Development Project Viewer application has successfully met the original project goals. It has also helped coordinate data updates internally. The GIS Department, which is responsible for coordinating address assignment with the county, monitors this site to learn about new and upcoming projects. Future coordination with the Community Development Department will involve formalizing the posting of multipage plan documents to make available new parcels and address assignments so that GIS can more quickly update the city GIS basemap layers. This integration of data maintenance associated with project developments has been an unexpected but well-received and eagerly pursued benefit to city staff. For more information, contact Ramona Navarette About the AuthorsRamona Navarrete is the GIS lead at the City of Folsom. She has worked on GIS projects with the U.S. Geological Survey's Volcano Hazards Program; California Department of Fish and Game; and the Air Force, Army, and Army National Guard. She earned a bachelor's degree in geology from University of Hawaii, Hilo. Mark Perry, a licensed professional civil engineer, is the president of GeoPrise (www.GeoPrise.Net) and has been a GIS professional for more than 12 years. He earned a master's degree in management information science/business administration and a bachelor's degree in civil engineering, both from California State University, Sacramento. |