October - December 2005
October - December 2005 |
||||||||
|
|
||||||||
Predicted storm surge depths were provided to the Mississippi Emergency Management Agency (MEMA) through regular conference calls with the Tropical Storm Prediction Center and the concerned National Weather Service offices. The values provided the afternoon before Hurricane Katrina struck on August 29 ranged from 16 to 32 feet. Areas near the Mississippi-Louisiana border would suffer the deepest surge whereas areas near the Mississippi-Alabama border would be less significantly affected. When I started working early the morning of August 28, Dr. Chris Mullens, a structural engineer from the University of Mississippi, was working with HAZUS-MH, a Federal Emergency Management Agency (FEMA)-sponsored damage prediction model that runs within ArcGIS. While the wind portion of the model was running well, there were issues getting the flood/storm surge predictions to work smoothly and correctly. While Chris focused on HAZUS-MH for wind damage estimates, I tackled the storm surge problem.
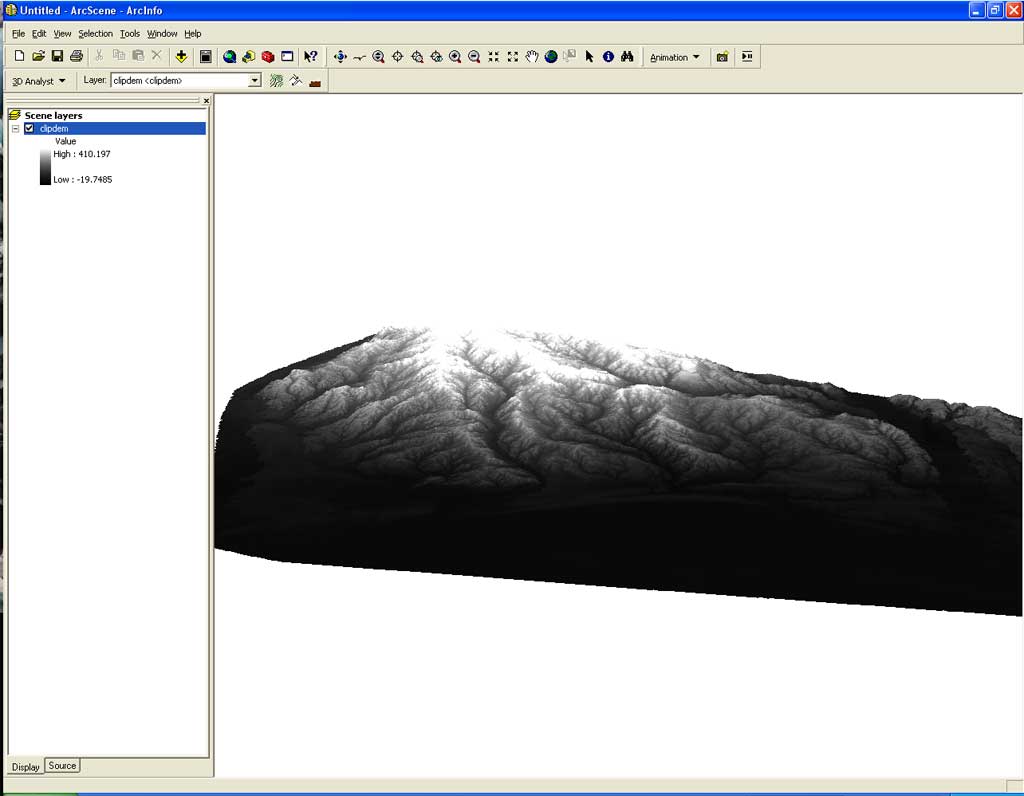
I wanted a quick, down-and-dirty method that would provide information that could be used for guidance [in placing response teams], but that erred on the side of caution. Although there are probably better methods for estimating the storm surge, this is what I came up with on the fly, without much sleep, and under time pressure. In my motel room the previous night, I had downloaded the Jackson, Harrison, Hancock, and Pearl River county digital elevation models (DEMs) from the Mississippi Automated Resource Information System (MARIS) Web site. I used ArcToolbox to convert the downloaded DEMs from .e00 format to DEMs for use in ArcScene in the ArcGIS 3D Analyst extension. As individual DEMs, they were a bit clunky to manipulate in ArcScene and the symbology from one DEM to another differed because each DEM had different elevation ranges.
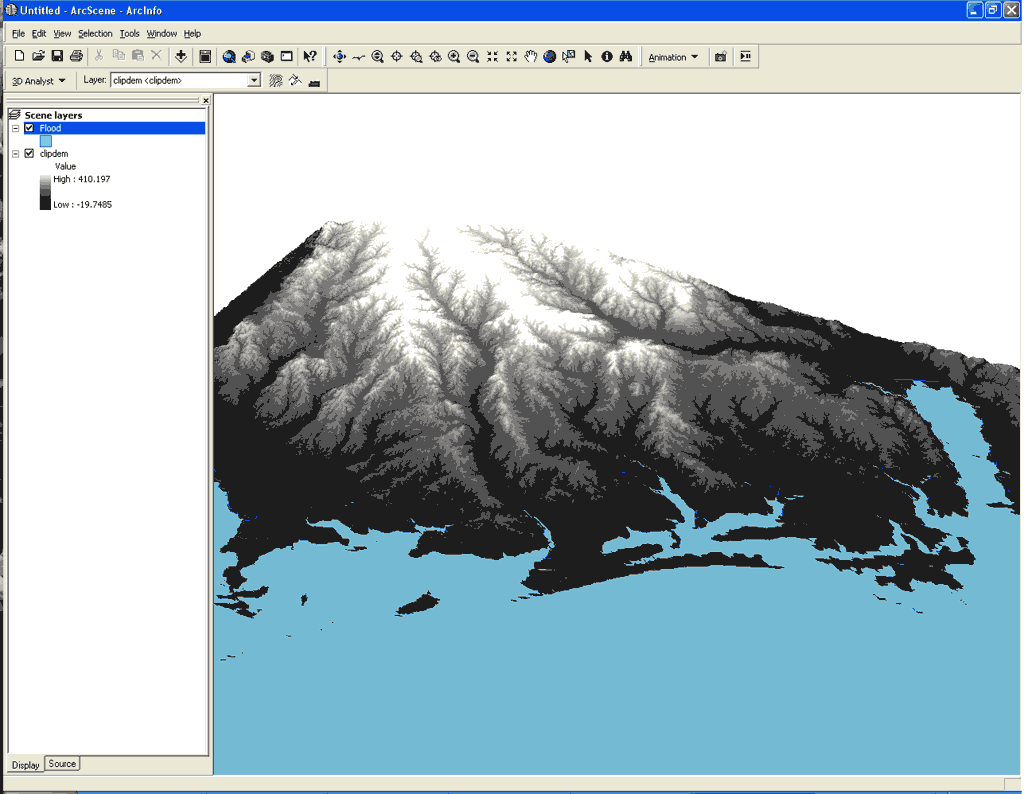
I stitched individual DEMs together using a tool called A Digital Elevation Model Utility that I downloaded from the ArcObjects Online Web site (arcobjectsonline.esri.com) at Samples > 3D Analyst> Data Conversion. This improved performance in ArcScene and allowed for consistent symbology across all four DEMs. In ArcCatalog, I created a new, empty polygon layer called Flood, enabled z-values, and loaded it into ArcMap. After starting an ArcMap editing session, I drew a rectangle large enough to cover the southern third of Mississippi and an area that extended about 50 miles into the Gulf of Mexico. After saving these edits, I loaded the Flood polygon layer into ArcScene and manipulated its elevation to create a plane that intersected the DEM. I used the CNTL + ALT + Print Scrn keys to make a screen capture looking straight down on the scene and saved it as a JPEG. I loaded the JPEG into ArcMap, merged the DEM, and quickly georeferenced the image. The area of intersection was digitized as a new polygon layer called Storm Surge. From this, a map was printed for use by decision makers. I repeated this process, at two-foot intervals, for storm surges between 16 and 32 feet. The final run showed the worst-case scenario—a 32-foot surge with 15- to 20-foot wave action on top and winds projected in excess of 150 mph.
Although I have not had time to make exact measurements since Hurricane Katrina hit, reports from the field indicate that flooding similar to the 32-foot surge prediction did occur although the flooding from Pass Christian to Biloxi was reduced significantly by a railroad track located approximately one-half mile inland. The bed was raised considerably but was not reflected in the DEM. The storm surge effects predicted helped operational managers pre-position response assets out of harm's immediate way and still within range to help. Although this strategy worked, I'd like to hear from others who might have better methods. For more information, contact Talbot Brooks, Director About the AuthorA chance encounter while delivering pizzas eventually led Talbot Brooks to a career in GIS. Brooks had received a bachelor's degree in biology/premedicine and intended to become a medical doctor. While waiting to report to Medical Service Corps officer basic training, he was delivering pizzas. A delivery to staff members of the Agricultural Research Service Lab in Chandler, Arizona, led to a temporary position as a research technician that evolved into a permanent position once Brooks returned from active military service. In 1998, he received a master's degree from Arizona State University (ASU). At the lab, he learned about remote sensing and GIS. The experience helped Brooks develop a keen interest in "using these technologies to better understand our world." Brooks took a position at ASU in January 2001 that allowed him to improve his GIS skills by taking Esri classes. With ASU geography chair Dr. Breandan O'hUallachain, Brooks created successful undergraduate certificate and master's GIS programs that combine theory with practice and ethics. His current position as director of the Center for Interdisciplinary Geospatial Information Technologies at Delta State University in Mississippi began in January 2005. Brooks and other geospatial professionals in the region are developing better standards for geospatial education, helping Mississippi develop a geospatial data infrastructure, and advancing the role of GIS in business and government. At a meeting of a local emergency operations center (EOC) on August 26, 2005, the center's head Kent Buckley asked if Brooks could form a team that would assist efforts at the state's EOC in Jackson. Along with Ken McCool and Leonard Locke, Brooks left for Jackson that evening. McCool directed public works reconstruction, Locke worked on the Mississippi Emergency Management Agency missing persons database, and Brooks set up a GIS to aid response efforts. |