October - December 2006
October - December 2006 |
||||||||
|
|
||||||||
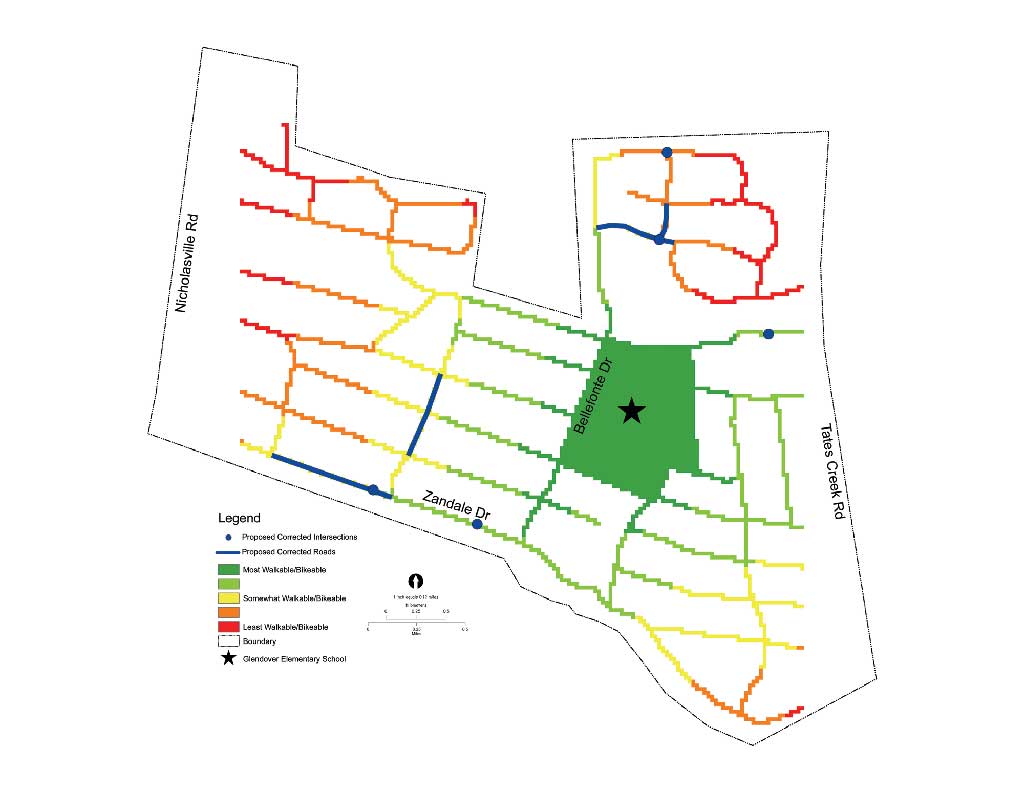
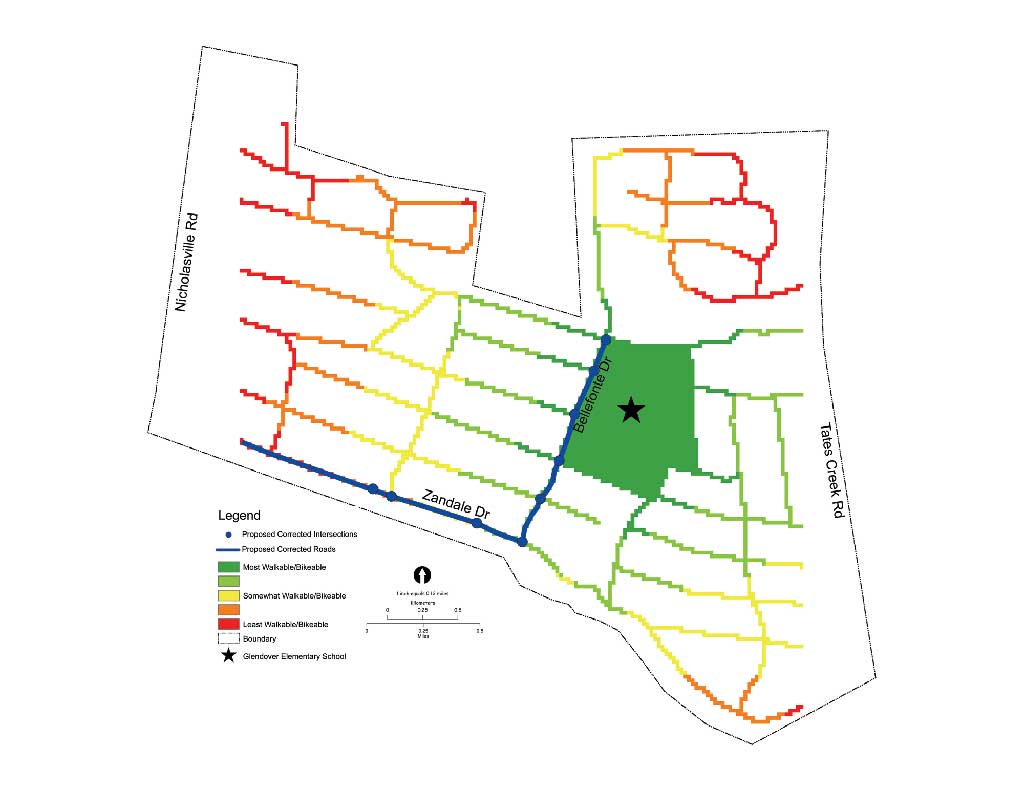
Using the audit data, the team was able to produce a series of maps depicting current walking and bicycling conditions within the project area and another series of maps that included straight-line walking distance, topographic slope, and children density. The straight-line walking distance map was created using the Multiple Ring Buffer tool in Analysis Tools in ArcToolbox. Rings were placed one-tenth of a mile apart with the center located at the neighborhood school. The topographic slope map was developed using a digital elevation model (DEM) downloaded from the United States Department of Agriculture Geospatial Data Gateway. The team used 2000 Census data to generate children density maps. To compensate for the age of the data, the Under Five Years of Age category was used because most likely these children are now five years of age or older and enrolled at the elementary school. The initial audit analyses and ancillary data helped visualize where problems existed and allowed the team to debate strategies on how to improve the walkability and bikeability for the neighborhood school. Visualizing the audit data revealed a string of the least suitable intersections and streets along two road corridors in the study area. The team could now visualize the data but needed a method to move virtually through the study area to evaluate alternative design solutions relative to existing conditions. Least-Cost Path Analyses
To determine the relative costs of going to and from school for the children, the team used the Cost Distance tool of the Spatial Analyst toolbox in ArcView 9.1 with the ArcGIS Spatial Analyst extension. The Cost Distance tool calculates the least accumulated cost distance to the nearest source over a cost surface for each cell. To use the Cost Distance tool, the team converted the initial vector-encoded audit data to raster surfaces. The team decided to evaluate three strategies to improve conditions based on a combination of the slope, audit, and children density into the overall friction surface. In ArcGIS terms, the friction surface is the Input Cost Raster and is most easily described as a raster defining the impedance or cost to move planimetrically through each cell. By changing the Input Cost Raster surface based on the proposed improvement strategies, the team was able to evaluate overall improvement relative to current conditions. ConclusionThe final analyses evaluated three solutions indicating a 12 percent, 48 percent, and 50 percent increase in overall study area walkability and bikeability. Because 50 percent of the evaluation was based on land slope, none of the three proposals for existing neighborhoods improved walkability and bikeability 100 percent. Although altering land slope is not easily changed in a developed neighborhood, modifying landform is possible when evaluating proposals for other neighborhoods in the planning phase. Thus, slope was included as a factor to allow portability of the methods for comparable results between developments. The student team was able to propose strategies that included a range of on-the-ground changes. Potential changes included adding proper curb cuts, painting crosswalks, adding stop signs, modifying vegetation, and adding sidewalks. These modifications ranged in cost and difficulty of implementation. The students also evaluated not only the types of strategies but also where to implement them. For example, the main trouble areas were found along two collector road corridors where many school-aged children lived. The students focused the recommendations on increasing the walkability only on these two streets. The overall walkability scoring was improved by 48 percent and would have less of a disruption for the residents during modifications (changes to nine intersections) than would be required for 50 percent improvement, which attempted to improve every rated section. Although overall walkability was increased, the team felt it would be the most expensive to implement because it involved more extensive construction projects over a more expansive area. The third approach was to take corrective action on the five most poorly rated intersections and street segments from the initial audit. However, this strategy yielded only a 12 percent improvement in the overall score. The Cost Distance tool enabled the team to visualize and understand that the addition of time and money did not necessarily improve walkability and bikeability in the greatest amount. The team was able to establish that relatively simple/inexpensive design improvements, such as stop signs and well-marked crosswalks and bike lanes along two collector streets, increased nonvehicular transportation options for children traveling to and from school in the neighborhood. The location, as well as the type of improvement makes a difference for evaluating overall neighborhood walkability/bikeability. This analysis and proposal evaluation method allowed for more informed debate among the team members on the best ways to improve walkability/bikeability conditions. Simply by changing the cost friction surface and rerunning the Cost Distance tool, the students could quickly test a variety of design solutions. Although not specifically part of this academic exercise, a cost-benefit analysis could be included for additional help in making decisions. This method could be easily adopted for use in projects underway or planned by government and nonprofit organizations as well as the private sector. For more information, contact Dr. Brian D. Lee College of Agriculture About the AuthorsBrian Lee is an assistant professor of landscape architecture. He received his bachelor's degree in landscape architecture and doctorate at Pennsylvania State University and both master's degrees at the University of Pennsylvania. He teaches land-use planning and GIS courses. Jared Cunningham is a fifth-year landscape architecture undergraduate student at the University of Kentucky. He works part-time for Parsons Brinckerhoff Quade & Douglas conducting a multicounty walkability/bikeability transportation study. AcknowledgmentsBlake Cooke, Ian Hundley, Matt Moore, Steve Austin, and Karen Goodlet ReferencesUnited States Department of Health and Human Services Centers for Disease Control and Prevention. "Physical Activity for Everyone: Recommendations: Are there special recommendations for young people?" July 5, 2006. www.cdc.gov/nccdphp/dnpa/physical/recommendations/young.htm. United States Department of Health and Human Services and United States Department of Agriculture. "Dietary "Guidelines for Americans 2005," July 10, 2006. Kentucky Geographic Network. United States Department of Agriculture and National Resources Conservation Service. Institute of Medicine of the National Academies. "Childhood Obesity in the United States: Facts and Figures," July 7, 2006. www.iom.edu/File.aspx?ID=22606. Fenton, Mark. "Engineering Physical Activity Back Into Americans' Lives." Progressive Planning, Issue 157, Fall 2003. www.plannersnetwork.org. |
|||||||||||||||||