
by Rob Buntz, GIS Project Manager
BTG, Inc./Delta Research Division
|
|
Preparing
for El Niño: Integrating the HEC RAS Hydraulic Model with ArcView GIS
by Rob Buntz, GIS Project Manager BTG, Inc./Delta Research Division |
 |
Vandenberg
Air Force Base (VAFB), the nation's third largest Air Force
base, occupies 98,000 acres located along 35 miles of the central California
coast north of Santa Barbara. Localized flooding at VAFB in 1983 and 1995
inundated important access roads and temporarily cut off access to facilities.
Fears that similar flooding could again result from this year's anticipated
heavy rains led the Base Planning section of the 30th Civil Engineer Squadron
to investigate methods for predicting flood levels.
Jane Goldberg, chief of the Base Planning Element, believed GIS could help model possible flooding. Her office has primary responsibility for GIS at Vandenburg Air Force Base. Goldberg started the GIS program on the base five years ago. "The feeling was that we'd invested a lot of time and effort building this [GIS] capability, now let's put it to use," says Goldberg. VAFB worked closely with the Delta Research Division of BTG Incorporated, an Esri Business Partner. BTG's staff of GIS technicians, analysts, and programmers at their Santa Maria, California, office provided consultation and technical guidance throughout the GIS implementation process. "When Jane first approached me about this flood modeling project, my immediate response was positive," said Rob Buntz, the VAFB GIS project manager at BTG. "It was a natural extension of the work we were already doing and, from a GIS analysis point of view, it seemed like an interesting and challenging project." In early September 1997, Goldberg and Buntz outlined the objectives and timetable for the project. We knew that when we were finished, we'd need a flexible tool to answer all the questions we were coming up with. Which facilities would be impacted if flooding does occur? How can we predict where the water will go? We also knew that for this to be effective, we'd need it up and running in a hurry," said Goldberg.
The project's initial objectives were broad. Goldberg and her staff wanted to know which roads and facilities were threatened by potential landslides. They also wanted to model flooding in a newly completed Military Family Housing area that could be caused by storm water runoff. As the project developed, these concerns became secondary to the threat of flooding of critical base facilities if the Santa Ynez River overflowed its banks. Project
Objective Study
Area Materials
The hydraulic modeling software HEC RAS, developed by the U.S. Army Corps of Engineers Hydrologic Engineering Center (USACE HEC) at Davis, California, was used to perform the floodplain simulations. ArcView GIS Version 3.0a for Windows 95 was used to develop the GIS data for hydraulic input, perform queries, and display the results of the simulations. Several AML routines developed by USACE HEC were used to prepare the GIS data for input into the modeling software and to create GIS layers from the model results. Methods
The clipped topography lines and points were then used to create a Triangulated Irregular Network (TIN) of the study area. Four arc coverages were then created depicting the stream centerline, the left and right overbanks, center of flow lines for the main channel and banks, and a series of cross sections perpendicular to the direction of flow. Three AML routines were executed to prepare the input to the RAS model from these GIS layers. The data were then imported into HEC RAS where simulations were performed. RAS requires as one of its components a Manning's n value. This value characterizes the surface roughness of the channel and left and right overbanks. Three n values are recorded at each cross section, one for the main channel and one each for the banks. The higher the n value at a given cross section, the rougher the surface. These values were estimated during field visits to the study area in November 1997. Planners were concerned that the dense growth of willow trees and other aquatic vegetation in the main channel along a substantial stretch of the river would impede flow. The vegetation, established downstream from a now nonoperational sewage treatment plant, has never been cleared. Gauging the effect of dense vegetation on rapid transmission of water downstream was of particular interest since the last FEMA flood study for this area was conducted in 1980, when the channel was relatively clear. "It's well established from a flood control point of view that clearing the channel would help to minimize impacts of flooding, but there are environmental concerns too," said Goldberg. "The willow trees provide important habitat for the Southwestern Willow Flycatcher, which is listed by our environmental staff as a species of concern." While the base needs to prevent flooding, it must also comply with regulations that require protection and stewardship of sensitive habitats. Once the GIS data had been imported and the Manning's n values assigned to each cross section, a series of simulations were executed using upstream flow values in cubic feet per second (cfs) as the only variable. Historic high flows at the United States Geological Survey (USGS) gauging stations in Lompoc were derived from the USACE report and used as input to the model. "We were able to re-create history, in a sense, by modeling floods that would have resulted from these historic high flows, but with contemporary channel conditions," said Goldberg. The report also defined the flows required to produce the intermediate regional and standard project floods for the Lompoc Valley. These values were used to model floods representing the "worst case" scenarios. Using n values for both a clear and a clogged channel, the team modeled channel flows with and without vegetation. Though determining whether to clear channel vegetation was not originally an objective of the project, Base Planning realized the need for considering this factor. Simulations were outputted to ASCII text files. These files were processed through several postprocessing AMLs that generated a TIN depicting water surface elevation and a polygon coverage representing the boundary of the inundated areas. The polygon layers representing the results of each model run were then used in ArcView GIS to perform spatial queries to identify facilities within the inundated area. ArcView 3D Analyst was used for data visualization and display. Conclusion
For more information, contact Rob Buntz at buntzr@santamaria.btg.com or 805-739-1860 and Jane Goldberg at 805-734-8232, ext. 6-1937. About
the Author |
 GIS
implementation at VAFB began in 1993 and the program has grown into one
of the most advanced in the Air Force. Base Planning operates a Sun SPARC
1000 Server, two SPARC Ultra II clients, four SPARC clients, and two Windows
95 PCs. ArcInfo Version 7.1.2 is used in combination with ArcView GIS
Version 3.0a running on UNIX and on the PCs. A customized ARC Macro Language
(AML) application offers a graphical user interface allowing point-and-click
access to the wealth of spatial data compiled in the last several years
and acts as a plot engine turning out volumes of maps that comply with
stringent Air Force cartographic standards.
GIS
implementation at VAFB began in 1993 and the program has grown into one
of the most advanced in the Air Force. Base Planning operates a Sun SPARC
1000 Server, two SPARC Ultra II clients, four SPARC clients, and two Windows
95 PCs. ArcInfo Version 7.1.2 is used in combination with ArcView GIS
Version 3.0a running on UNIX and on the PCs. A customized ARC Macro Language
(AML) application offers a graphical user interface allowing point-and-click
access to the wealth of spatial data compiled in the last several years
and acts as a plot engine turning out volumes of maps that comply with
stringent Air Force cartographic standards.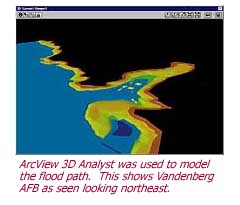 Buntz
contacted Dean Djokic PhD, a hydrologic engineer with Esri's Professional
Services Division. They developed a plan to meet the project objectives
in under two months.
Buntz
contacted Dean Djokic PhD, a hydrologic engineer with Esri's Professional
Services Division. They developed a plan to meet the project objectives
in under two months. Historic flow levels for the Santa Ynez River were obtained from a USACE
report, and the results from previous hydraulic model runs upstream from
the base at Lompoc, California, were available from the Federal Emergency
Management Agency (FEMA). These data were examined to determine the highest
ever predicted water surface elevation. This value identified the highest
elevation for which topographic data were needed. A polygon roughly delineating
this elevation along both edges of the river was digitized "heads
up" in ARCEDIT, then used to clip the contour and point data.
Historic flow levels for the Santa Ynez River were obtained from a USACE
report, and the results from previous hydraulic model runs upstream from
the base at Lompoc, California, were available from the Federal Emergency
Management Agency (FEMA). These data were examined to determine the highest
ever predicted water surface elevation. This value identified the highest
elevation for which topographic data were needed. A polygon roughly delineating
this elevation along both edges of the river was digitized "heads
up" in ARCEDIT, then used to clip the contour and point data. 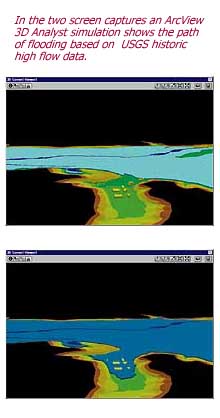 "When we started looking at the n values used in the last study,
it was clear that we'd need to almost double them in some places to account
for the willows," said Buntz. Engineers at the Santa Barbara County
Flood Control District also wanted the clogged channel cleared.
"When we started looking at the n values used in the last study,
it was clear that we'd need to almost double them in some places to account
for the willows," said Buntz. Engineers at the Santa Barbara County
Flood Control District also wanted the clogged channel cleared.