by John Defina, Izak Maitin, and Dr. Arnold L. Gray
|
|
New
Jersey Uses GIS To Collect Site Remediation Data
by John Defina, Izak Maitin, and Dr. Arnold L. Gray |
|
The New Jersey Department of Environmental Protection Site Remediation Branch (NJDEP SRB) will use ArcView GIS to manage environmental remediation data. Through the State-wide collection of environmental information in electronic format, managers will have the basic data to support geographic analysis and display elements on a site-by-site basis.
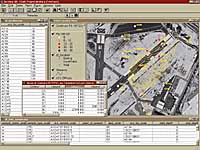
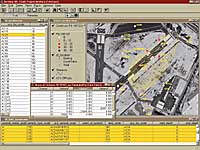
Above: Using the EQuIS-ArcView GIS interface, managers can quickly and seamlessly retrieve data for a project or set of projects. |
Using
GIS To Manage Remediation Data
GIS holds great potential as a tool for managing environmental site remediation data. While using GIS to locate Superfund sites is commonplace, GIS has played only a minor role in the review and analysis of chemical data gathered during an investigation or monitoring activity. There are a number of reasons why GIS has not become commonplace in the evaluation of site remediation data. First, remediation projects generate huge volumes of data. Hard-copy Quality Assurance/Quality Control (QA/QC) reports can easily fill 10 or more boxes. Transferring data from paper to electronic format can be a daunting and costly task. Second, GIS traditionally has not been used by remediation specialists during the decision making process. Typically the work of project managers, chemists, geologists, and risk assessors is brought together in static reports. A method for integrating these reports with GIS was not immediately apparent. Some participants in the remediation process were unfamiliar with GIS and related computer technologies. In addition, objective measurements for pollution abatement have not been agreed on within the regulatory community. "Bean-counts" and dollars spent on cleanups or containment have been the classic measure. While easily compiled, these data have not demonstrated a direct link to enhanced safety to people or the environment. Actually, this method of measuring progress has been a major source of friction between regulators and the regulated community. Changes
Favor Adoption of GIS
Using Digital Data
Developing
the Program
The HAZSITES data entry program, distributed by the NJDEP, facilitates manual entry of site data. The regulated community may submit data produced in other applications such as spreadsheet and database programs, or supplied by laboratory or contractor. Other software tools track data submissions, move data through the organization, and preserve meta-data associated with data deliverables. |
|
Ensuring
Data Quality
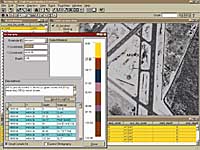
Additionally, users may organize constituent groups, locations, and regulatory limits to support the analysis of data over a particular site or group of sites. For example, a project manager could group shallow monitoring wells to evaluate all volatile organic compounds above a particular cleanup level. This ability to aggregate data is critical to investigating site conditions. Implementing
GIS Using the EquIS-ArcView GIS interface, managers can quickly and seamlessly retrieve data for a project or set of projects. Ancillary project information, such as location groupings and regulatory thresholds, are available through the interface if this information was incorporated in the data management system. The interface can connect to any project supported by EQuIS. Project data refresh each time the ArcView GIS interface is invoked. Accessing an updated common repository ensures that users are working with the same data as well as using the same conventions. Data evaluation can be performed using a custom graphic user interface (GUI) or through standard ArcView GIS functions. Because this interface supports open system design, experienced programmers can easily develop their own ArcView GIS tools using the data tables that are provided within the interface. The EQuIS environmental data management system addresses the problem of integrating analysis results from non-GIS tools. Data are stored in a common repository which is integrated with a variety of third party tools such as Surfer, Stratos, GMS, and LogPlot. Data generated using these tools can be combined within the ArcView GIS interface if these data contain coordinate information. From within the EQuIS-ArcView GIS interface, live data can be retrieved and compared using the tools that resource managers have long relied on for decision support. Changing
Performance Measurements
This information will be used by departmental managers, the legislature, the environmental community, the regulated community, and the general public. Agency goals are being revised so they will be evaluated in terms of EIs. Accurate and reliable EIs that are understandable and communicable in nontechnical terms are vital for evaluating the progress of remediation activities. Quantitative
Environmental Indicators
QEIs attempt to quantify factors that are not otherwise measurable such as the effectiveness of groundwater contamination extraction, amount of continuing sources or natural attenuation to groundwater, and identification of the contribution of unknown sources to groundwater. QEIs are defined by performing spatial operations that calculate the aerial extent of contamination, approximate the volume of contaminant, and derive the contaminant mass. QEIs provide insight into the dynamics of the system and relative contaminant distributions. Classification Exemption Areas are defined as local areas of groundwater that do not meet water quality standards. The NJDEP SRB explored mapping the Classification Exemption Areas with GIS as a tool for calculating and visualizing QEIs. Case managers were contacted to arrange access to files. After reviewing these files, maps showing the aerial distribution of contamination were generated using direct digitizing. This approach proved tedious and sometimes did not produce a map. Graphic representations for QEIs were not feasible unless data were available in electronic format and could be manipulated through a GIS. Providing
Better Information on More Sites
Through this program of environmental data collection and standardization utilizing GIS, the NJDEP is creating the framework for a system that provides the regulatory community with his information to make better decisions, communicate the status of environmental conditions, and improve service to the residents of New Jersey. For more information on the New Jersey Department of Environmental Protection, go to www.state.nj.us/dep/. For information on EquIS and Earthsoft, Inc., visit www.earthsoft.com. About
the Author
About
the Coauthors
Dr. Arnold Gray worked for the New Jersey Department of Environmental Protection's ECRA program overseeing and developing computer systems for remediation projects. He continued this work as an assistant professor at the Richard Stockton College of New Jersey and is the founder of the Geographic Analysis and Environmental Assessment (GAEA) Corporation, headquartered in Cherry Hill, New Jersey. He received a Ph.D. in geography from Clark University. |