By Ryan Eckdale-Dudley, Alex Sukupcak, and Kyle Engelking, Symbiont; and David Simpson, City of Wauwatosa

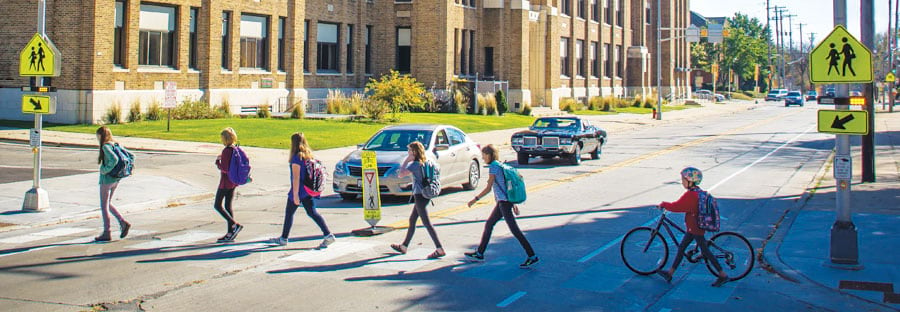
Every child should be able to get to school safely, whether he or she walks, bikes, takes the bus, or gets dropped off by a parent. That’s what the National Center for Safe Routes to School—part of the University of North Carolina’s Highway Safety Research Center—works to ensure. It sees this as the first step to making entire communities safe for pedestrians and cyclists.
The City of Wauwatosa, Wisconsin, recently sought to improve its own Safe Routes to School program. The city was awash in location data about where students lived, where their schools were, and where there were crossing guards—but it didn’t have a way to use this data to benefit students and parents. So senior management decided to leverage all this existing data, plus newly collected data on infrastructure and environmental factors, to create an interactive web-based app that could help parents identify safe, walkable routes to school near their homes. Wauwatosa also hoped it could use the app to make better-informed decisions about potential infrastructure improvements.
The city partnered with Symbiont Science, Engineering and Construction, Inc., and got started.
Identifying What’s Safe, and Where

Before the team could begin building the app, it had to identify the environmental factors and infrastructural features that make a route safe and walkable for students—like having well-placed crosswalks and sidewalks and adequate traffic signage. So Symbiont mapped all this out to determine where the city needed additional marked crossings.
To collect this data quickly and easily, Symbiont used Collector for ArcGIS. It took about an hour for the GIS team to assemble a data schema in ArcGIS Desktop and publish a web map to use to denote where street crossings were located and how safe or unsafe they were.
The Symbiont GIS team then took Collector out into the field to document all of Wauwatosa’s street crossings and their characteristics. Since most of the city’s street crossings are uncontrolled intersections that lack both paint and pedestrian signs, the team assigned default values in Collector to prefill the attributes of a crosswalk data point—noting whether it was painted or not, if it was a controlled or uncontrolled intersection, and whether pedestrian signs were present.
When a team member encountered a crosswalk, he or she would add a point with the pre-filled attributes to the map. If that crosswalk did have additional attributes—such as a stop sign, a traffic light, pedestrian crossing signs, or crosswalk markings—the team member would add these elements to the data point using a simple drop-down menu.
It took the City of Wauwatosa just over 40 hours of fieldwork to have a complete database of its 2,130 street crossing assets.
Creating New Safe Routes

Once this data was collected, the city assigned each crosswalk an overall safety score based on its individual attributes. Controlled intersections with traffic lights and stop signs received higher safety scores, while crossings at uncontrolled intersections or in high-traffic areas received lower ones.
Symbiont GIS staff then looked at the distribution of student residences to determine where safer walking routes were needed. The team used the ArcGIS Online World Geocoding Service to map the location of each student residence in relation to his or her school. Using heat maps, the team showed areas throughout Wauwatosa that had a high density of student residences within one mile of a particular school. These were ideal areas for new safe routes to originate.
After assembling the required datasets on crosswalks, student resident locations, and traffic volume, the GIS team used ArcGIS Desktop to generate suggested safer routes by connecting existing sidewalks with the safest crosswalks (according to their scores). Symbiont’s team then published these proposed safe routes to ArcGIS Online as feature services so they could be incorporated into both an internal app and a public-facing one.
Making a Helpful Tool for All
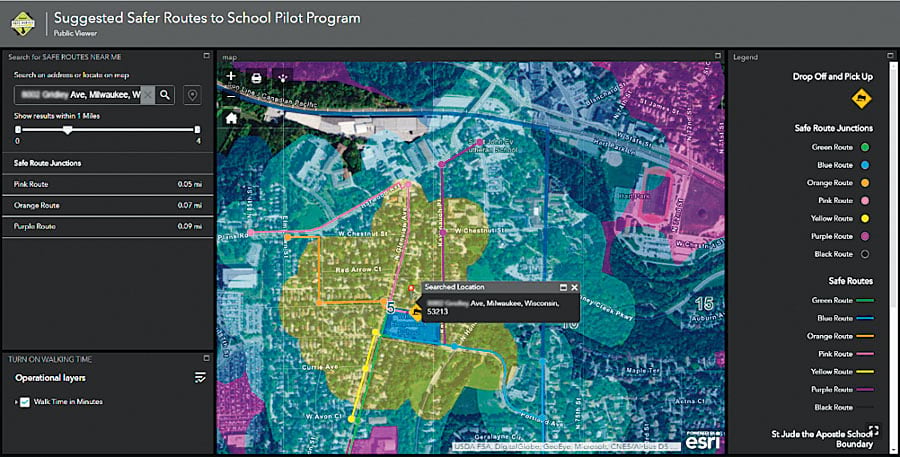
To build the apps, Symbiont’s GIS staff first brought the published layers together in a web map using Web AppBuilder for ArcGIS. With its what-you-see-is-what-you-get interface, Web AppBuilder for ArcGIS made it easy for the team to quickly build a powerful and intuitive web app—without writing any code. Modifiable themes, such as the Dashboard theme, allowed the team lots of flexibility in designing the look and feel of the app. And Symbiont was able to configure widgets that make it possible to do more than simply view routes. For example, with the Safe Routes Near Me widget, parents and students can quickly search for the safe route nearest their home and receive directions for how to get to it.
To further enhance the city’s vision of creating a helpful tool for parents, Symbiont added operational layers to the suggested safe routes. The Walk Time in Minutes layer, for instance, shows parents how long it will take their kids to walk to or from school based on where they get dropped off or picked up. With features like this, the app became even more valuable and user-friendly.
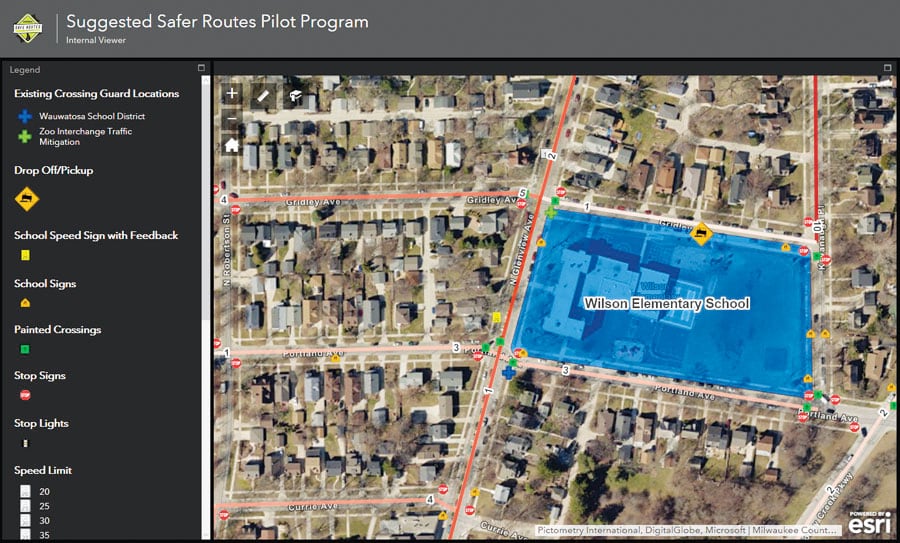
In addition to the public-facing app, the Symbiont team built a private, internal viewer for city officials. Data incorporated exclusively into the internal viewer includes student distributions; crossing guard locations; and crosswalk sites, along with their scores.
Wauwatosa has used the data to strategically relocate crossing guards to more appropriate intersections. The viewer also allows city officials and planners to identify areas that need infrastructure enhancements and pinpoint issues that they couldn’t see before, such as the relationship between where crossing guards were placed and student residents are located.
“Utilizing this GIS application to make decisions related to placement of crossing guards has [proved] to be an invaluable tool,” said David Simpson, the director of public works for the City of Wauwatosa. “I feel that we can be better stewards of the taxpayers’ investments into this community by having this tool available to us as we make capital improvement decisions.”
Implementing a Data-Driven Solution
After Symbiont finished building the public-facing app, the City of Wauwatosa unveiled it in a pilot program at Wilson Elementary School in July and August 2017. City officials met with school administrators and parent organizations to educate the community about the app.
For Wilson Elementary, the city’s GIS identified seven safe walking routes that parents could use to take their children to school. During the pilot program, the public was able to use all the app’s features, including the Safe Routes Near Me widget and the Walk Time in Minutes layer.
Feedback from parents and school administrators who participated in the pilot program was positive and encouraging. And the Symbiont team intends to continue gathering comments on specific safe routes using an Esri Story Map Crowdsource app that is currently in development.
Based on the success of the Safe Routes to School pilot program, policy makers for the City of Wauwatosa have adopted this data-driven solution to enhance its entire Safe Routes to School program. The district-wide app is expected to launch in time for the 2018–2019 school year.
“This GIS application will likely become the center of the city’s Safe Routes to School program,” added Simpson. “Communications to parents and students will be dramatically improved by having [it] available.”
Using GIS to identify and communicate safer walking routes enabled the City of Wauwatosa to ensure that more local kids have safe passage to school. By embracing a data-driven approach and leveraging Esri’s GIS tools, Wauwatosa residents and city officials alike have realized the importance of place and gained a better understanding of The Science of Where.
About the Authors
Ryan Eckdale-Dudley, Alex Sukupcak, and Kyle Engelking are GIS consultants at Symbiont, which specializes in providing innovative, Esri-based solutions to its clients. David Simpson is the director of public works at the City of Wauwatosa, where he champions the use of GIS technology to improve workflows and operations.
For more details, go to symbiontonline.com, email Eckdale-Dudley at ryan.dudley@symbiontonline.com, or contact Simpson at dsimpson@wauwatosa.net.

