Port of Rotterdam Ensures a Resilient Future with ArcGIS
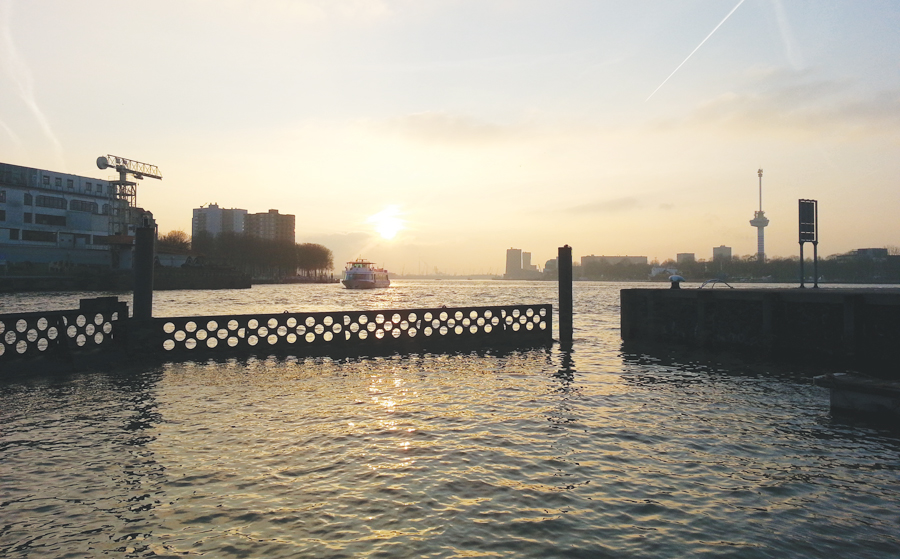
The Port of Rotterdam (POR) bustles like a metropolis. The Netherlands port handles more commercial shipping than any port in Europe and more than most ports in the world. In 2013, it docked more than 130,000 vessels and processed a staggering 440 million tons of shipping cargo. Perched on the North Sea, it stretches 26 miles inland along the river Maas, the primary gateway to more than 500 million European consumers.

Industrial Processing Center
More than a large place where ships load and unload their cargo, POR forms an immense industrial center where raw material gets processed into commercial products. Oil is refined, synthetics are produced, and fruit is repacked for wholesale. Around 90,000 people work at the port in some capacity to accomplish this work.
The Port of Rotterdam Authority has relied on a complicated supporting system just to maintain its enterprise operations. As a world-class port, POR can’t be content with mere maintenance. Ports grow and expand. When they reach the limits of outward expansion, they still need to grow internal efficiencies as operations increase in complexity.
To ensure POR met the fiscal goals of a recent expansion, the authority needed a platform to connect all its systems, improve usability, and get all departments on the same page. Last year, after a competitive bid that tested top asset management systems in a lengthy proof-of-concept phase, POR tapped the expertise of the Esri Nederland B.V. and Esri Professional Services teams to implement an ArcGIS platform called PortMaps and unify its operations from bottom to top.
“It boiled down to uniformity of user experience and how quickly the platform could be fully operational,” says Frits van der Schaaf, business development director for Esri Nederland. “Staff needed workflows to be tight and effective and the transition to be fast and seamless.”
Maasvlakte 2: The Final Expansion
Last year, the port completed a massive, 1.5-billion-euro expansion into the North Sea, called Maasvlakte 2 (m2). That expansion defined the port’s total land area for decades to come. Further growth meant working more efficiently to generate greater revenue from every available acre. Until last year, POR’s enterprise management consisted of a legacy GIS that threatened to inhibit the authority’s internal growth and profitability in the wake of m2. Its main flaw was that it couldn’t easily connect to dozens of other business systems used to manage operations.
“There won’t be a third Maasvlakte expansion,” says Erwin Rademaker, program manager for PortMaps. “The only way to let the shipping traffic grow is to handle the available space and resources we have more efficiently and intelligently.”
PortMaps
The port authority wasn’t simply looking for a contractor to do the work. It needed a partner willing to work with it and its affiliate ports to transform how they manage assets. As staff learned more about what a modern GIS could do, they embraced the idea of a complete geospatial platform to manage all the port’s business.
When Esri told them it could be done in five months, staff could hardly believe it. The other “best of breed” systems fell short of providing a snappy user experience, and none of them could be configured in such a quick time frame. ArcGIS was the only platform that could phase out 49 of the port’s systems at once with relatively little disruption. Esri Professional Services and Esri Nederland worked with the authority to integrate the ArcGIS platform with key enterprise business systems, including SAP, AutoCAD, and Microsoft Office; develop workflows and an enterprise data model; and build a geodatabase that includes port assets and boundaries, parcels and associated land records, utilities, transportation, bathymetry, imagery, and lidar.

The authority’s requirement for asset management was so specific that it mandated the workflow should only take three mouse clicks (or touch screen taps) for anyone at the port to find any asset. The implementation thus required migrating more than 1,500 layers of port data into an enterprise ArcGIS database and developing a data maintenance workflow for 10 core port objects. The idea was to work through many of the steps with port authority employees and enable them to perform the rest of those steps themselves.
“Much of the staff training involved staff actively participating in the data conversion process,” says van der Schaaf. “Once data was migrated and the initial layers created, work shifted to configuring templates for information products needed by the port, such as the port basemap and dredging atlas.”
The first phase of the implementation took five months to complete and was deployed in January 2014 as PortMaps. At this formative stage, PortMaps easily outperforms the port’s old GIS as an asset management system. It uses a detailed map of the port as a starting point from which information can be requested by anyone at any time. Departments are also able to instantly share information on mobile devices.
In Operation
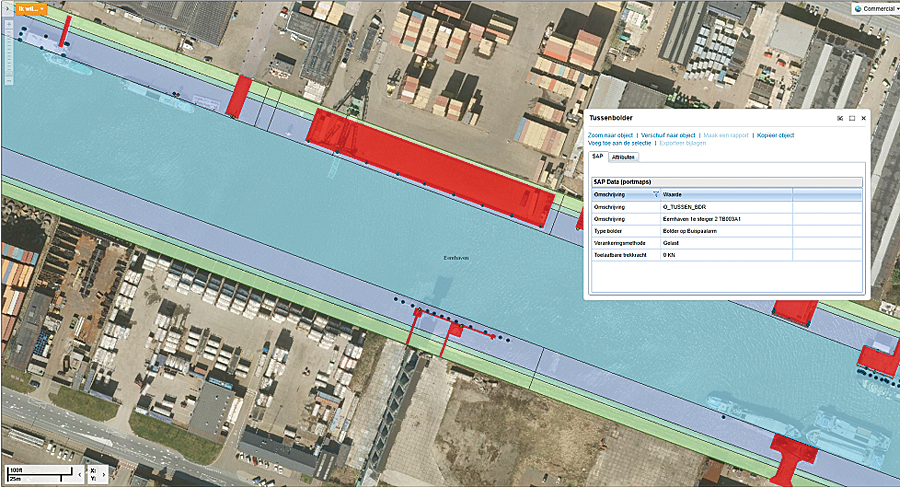
Port Authority employees currently use PortMaps to access and update a range of port information. It plays a central role in the organization’s environmental management, security and safety processes (e.g., maritime traffic control), area planning, port development, and incident response. For example, an employee can click or tap on the main map in PortMaps to view a contract stored in SAP that belongs to the part of a quay (concrete platform where goods are off-loaded). Vehicles and other assets can be tracked and monitored and their associated records viewed. The map/document connection simplifies staff work, eliminating the leapfrogging from application to application that characterized the old information system.
“There are all sorts of objects on the terrain: railroads, piping, electricity cables, and so forth,” says Rademaker. “ArcGIS clearly shows the intersection of these objects and opens access to their associated documentation through simple pop-up windows, giving the port a much more sensible and immediate system for port management.”
Applicability and What’s Next
The POR Authority considers PortMaps to be a groundbreaking approach to port management. As the GIS foundation at POR gains strength, the authority plans to implement the ArcGIS platform in its affiliate ports around the world. The next two phases will further integrate the platform with expert systems for structural degradation analysis and risk/business value assessment.
“The key factor in POR’s excitement was discovering the applicability of a modern GIS,” says Chris Cappelli, Esri global director of sales. “Early on, staff could see the GIS could reliably be applied to every aspect of port business.”
For more information, contact Erwin Rademaker, program manager, Port of Rotterdam and Guy Noll, Esri.

