Geology, Journalism Students Collaborate to Learn About Environmental Science, Storytelling
Science and journalism have a lot in common. Both fields require practitioners to ask questions, explore data, analyze information, and then act on the knowledge gained—usually by preparing a final report, whether it is a scientific paper or a news article.
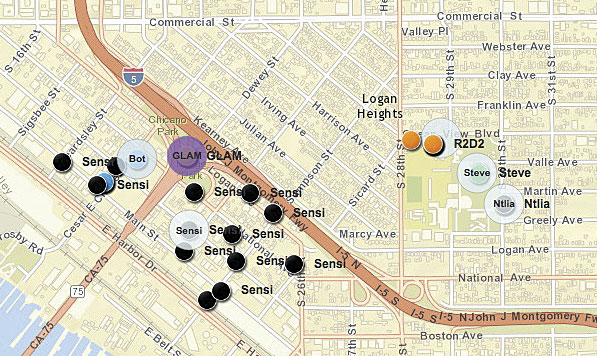
At California’s San Diego State University (SDSU), students from the journalism and geology departments recently collaborated on a 15-week live news and science experiment to explore the air quality in four San Diego neighborhoods: Barrio Logan, Logan Heights, Chollas Creek, and Bankers Hill. Funded by a grant from the Online News Association, students built sensor kits (based on open-source technology) that measured particulate matter and different gases—such as liquefied petroleum gas, isobutane, methane, and smoke—in the air. They then used Esri software to map and analyze the information collected by the sensors. In the end, the students produced nine news stories and two videos for inewsource.org, an independent, data-driven online news organization based in San Diego.

The framework for the course was grounded in the geographic inquiry process espoused by Esri, which encourages students to ask questions, explore and analyze data, and then take action on their findings. By engaging in this process, students not only advanced their scientific and journalistic skills, but they also learned how GIS can be a comprehensive yet simple tool for scientists, journalists, and the public to use to discover details and share stories about the environment.
What Is in the Air?
Bound by mountains on most sides and beset by dry air, with quintessential Southern California freeway congestion and the state’s fourth-largest maritime port, San Diego tends to attract and retain pollution.
The American Lung Association’s “State of the Air” report for 2015 ranked San Diego 35th out of 180 cities for the number of days with high levels of ozone pollution, or smog. The report also ranked the San Diego area 39th for the average amount of particle pollution (a medley of extremely small liquid and solid pollutant particles) present during a 24-hour period and 40th for the levels of particle pollution in the air annually. This is actually a significant improvement from 2011, when San Diego ranked 7th for ozone pollution and 15th for short-term particle pollution.
To sustain—and hopefully accelerate—these improvements in air quality, it helps to know what is in the air. From early February to late April 2015, students in SDSU’s digital journalism class monitored the air quality in different parts of San Diego with the ultimate objective of better informing the public about the area’s pollutants and their effects.
Mapping and Visualizing Pollution
To begin the project, students assembled environmental sensor packages developed by SDSU staff and a sensor consultant using open-source technology. Each kit included sensors that pick up airborne particulate matter and gases. They each also had an Arduino board that read the sensor information every 30 seconds. This small computer then sent the data to an LCD display, which showed details about the presence and concentration of different pollutants in the air. The data collected by each kit was stored in a mini SD card in the Arduino board.

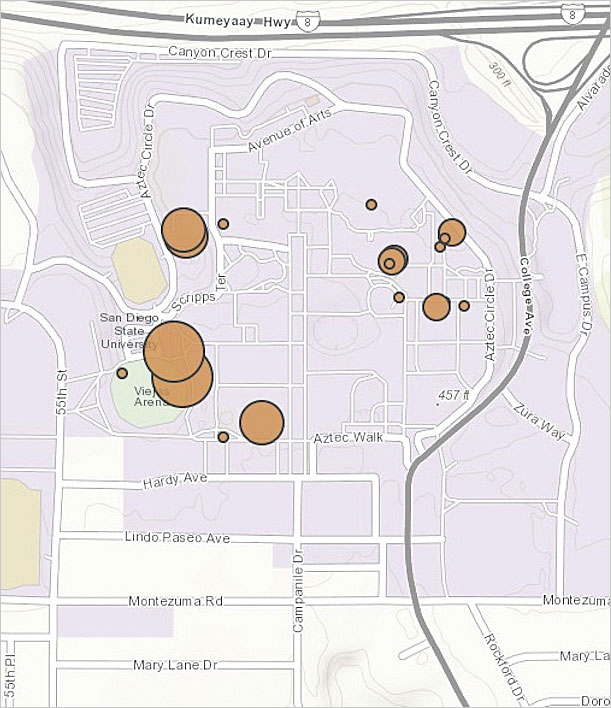
After each of their eight data collection trips (where they went to the same spots on the same day of the week at the same time), students would take their mini SD cards and put the recorded data—along with the longitude and latitude where each recording was taken—into a spreadsheet. These emerging GIS practitioners would then import the tabulated data into ArcGIS Online and map it.
Students quickly learned how much easier it was to visualize their data once they turned their spreadsheets into maps. GIS equipped them with simple tools that allowed them to examine patterns in the environment and trends in various neighborhoods—and then communicate these stories with their maps.
Bringing Stories to Life
GIS not only helped the students find their stories but also made their stories come to life. Many of them presented their accounts as news articles on inewsource.org.
As one student reported, in the neighborhood of Barrio Logan, which is sandwiched between the Interstate 5 freeway and the Port of San Diego, high volumes of particulates were discovered—especially from black carbon, which, according to the article, is the most noxious fine particle. With little wind to blow pollution away and the additional strain of having the San Diego Coronado Bay Bridge overhead in some areas, this neighborhood has one of the worst air quality ratings in all of San Diego.
Students also discovered that Logan Heights, just north of Barrio Logan, is afflicted by similarly low-quality air. Located between two freeways, its residents—especially children—are at high risk of developing and exacerbating respiratory illnesses such as asthma.
Bankers Hill, however, fared pretty well. Students reported on inewsource.org that although the neighborhood sits directly to the east of San Diego International Airport and is also circumscribed by freeways, this hilltop district receives constant wind—enough to break up pollutants. That said, some areas of the neighborhood that are closer to the freeway experience an eddy effect, meaning that the wind recirculates polluted air.
Underlying all these observations were the students’ ArcGIS Online maps. Those made the data meaningful and animated the science.
The Sky Is the Limit
The sensor journalism project engendered a truly collaborative environment. It brought together students from different majors, teachers and faculty from various SDSU departments, and journalists from within the community. And GIS served as the foundation for everyone’s exploration and research.
With ArcGIS Online, the class was able to easily make maps and work together on such an encompassing project. Students learned how to collect primary-source data, utilize existing GIS databases to understand and investigate the environment, and create maps to tell stories about the world.
The air quality information displayed on the class’s final map, which amalgamates all the pollution recordings the students took in their assigned neighborhoods, helps supplement existing air quality data. It guided the students as they did further field investigations, studying wind patterns and conducting interviews. It also helped them hypothesize about and analyze pollution patterns, sources, and impacts in San Diego’s neighborhoods.
The SDSU staff involved in this project continues to fine-tune an interdisciplinary curriculum that brings together geology and journalism students to learn how GIS can contribute to scientific investigation and news reporting. What this project has demonstrated is that, through innovative and cooperative efforts—using cutting-edge technology, open-source tools, and an experimental approach—the sky is the limit to how much students can learn.
For more information on the sensor journalism project, email Amy Schmitz Weiss, associate professor of journalism at San Diego State University, or Kevin Robinson, lecturer in the department of geological scientists at San Diego State University.

