Wrapping up a great year of development with ArcGIS Online, the December update to the software included more advanced GIS capabilities, additional improvements to the user experience, and better ways to manage accounts and share work.
Boosting Advanced GIS Capabilities
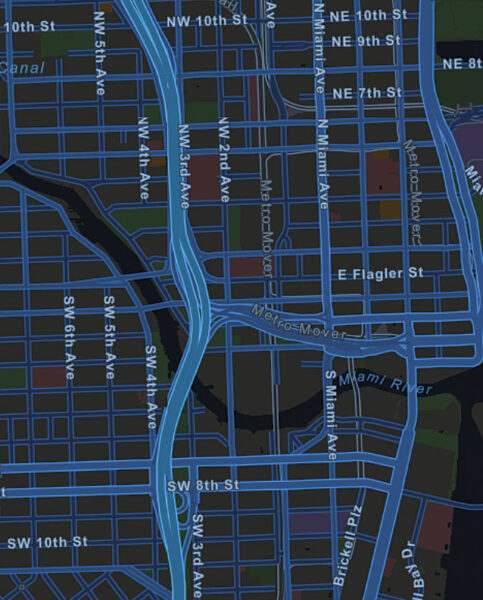
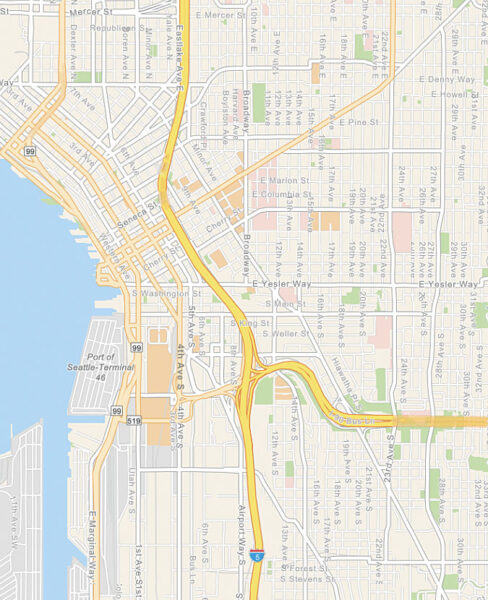
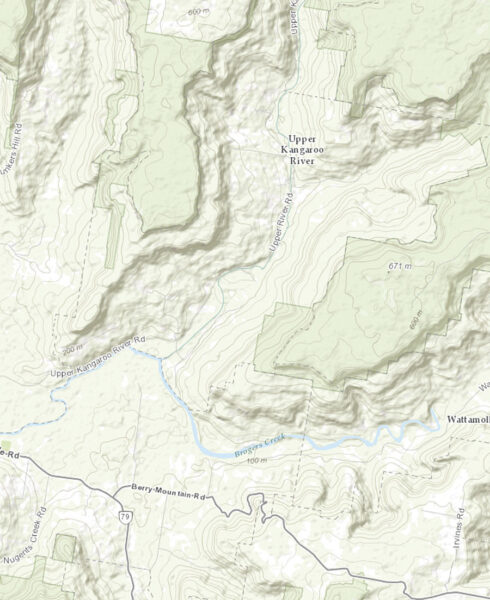
Esri vector basemaps came out of beta in the December update. The new vector basemaps feature nine styles from a single tile service. The styles—which are derived from commercial, community, and open-source data—include dark and light gray canvas, three street variations, terrain with labels, navigation, topography, and an imagery hybrid. These map styles, which users can customize, are published as tile layers or web maps. They deliver a better display on high-resolution devices and can be updated more frequently.
With point layers in the scene viewer, it is now possible to incorporate both 2D and 3D symbology. For example, if wind speed is a numeric attribute in a dataset, it can be visualized with proportional symbols for color and size based on the wind speed value. The camera animation for point-to-point flights in the scene viewer has also been enhanced to provide a smoother user experience.
ArcGIS Online now has expanded analysis functions as well. The new Join Features tool transfers attributes from one layer or table to another based on spatial and attribute relationships. This is especially useful for operations such as appending common boundary or demographic information to incident data, identifying the facilities closest to a known location, or determining the number of residences that fall within flood zones. The new Find Outliers tool, which identifies features whose values are significantly different from other data points, creates maps that show statistically significant clusters and spatial outliers in the data. This tool can help answer questions such as
- Where are the sharpest divisions between affluence and poverty within a study area?
- Are some stores struggling with low sales, despite being near high-performing stores?
- Where are there anomalous spending patterns?
- Are there counties in the United States with unusually low life expectancy compared to their neighbors?
Additionally, demographic maps for Canada, the United States, and several other countries were updated in the December release. Canada now features 2016 demographic data. Maps for the United States now include the latest US Retail MarketPlace and Shopping Centers data, and daytime population information is available for mapping and analysis. Other countries with more current data include Belgium, China, Denmark, Finland, France, Germany, Italy, the Netherlands, Norway, Poland, Russia, Spain, Sweden, Switzerland, and the United Kingdom.
A More Inviting User Experience
When styling and labeling feature layers in the map viewer, users can now author; edit; or apply Arcade, a new scripting language. For example, a user could create an expression to generate a yearly sales figure for individual territories by summing the value of monthly sales fields. The yearly sales figures would then be represented as different-sized symbols on the map. Moreover, users can now edit or delete attributes, photos, and files directly in the feature layer attribute table in the map viewer.
Enhancements were also made to time animation in ArcGIS Online. For layers with live data, a new tool called Show Advanced Options allows users to view the temporal extent of the data when reopening a saved map instead of merely seeing static content. When filtering feature layers by date, users can set a relative extent for the animation as well, making the start time for the animation the last day data was recorded, for example. Users can save the position of the time animation slider, too, so when they reopen the map, the slider defaults to that spot. Additionally, the start of the time slider can be controlled in the configured extent.
ArcGIS Online is now available in 34 translated languages as well, including Bosnian and Indonesian.
Simpler Administration and Sharing
The updated ArcGIS Online enables users to create new organizational accounts with credentials from social networks, such as Facebook and Google. There is also a new cost-effective way for subscribers to increase the number of people in their organization who can view the GIS work being done in ArcGIS Online. Users can now share mapping work with executives, fieldworkers, analysts, and other select individuals without making the data public.
To learn more about the updates to ArcGIS Online included in the December release, visit the ArcGIS Online What’s New page and check out the ArcGIS Online blog.

