The authors have developed a Python tool that steps users through the process of creating a ring map. They have provided this tool in a toolbox along with some sample data that can be used to create a ring map.
The multitemporal dimensions of attribute data are difficult to display in a single map. Traditionally, users either make the multiple line graphs for presenting the temporal trends in different locations or create bar charts on a GIS map. However, multiple line graphs cannot visualize the spatiotemporal correlation together, and bar charts are sometimes problematic because charts may overlap.
In 2008, researchers at the Georgetown University Medical Center in Washington, DC, proposed using ring maps to integrate the multidimensions or multiattributes data into one simple map. [This work by Guilan Huang, Sergio Govoni, Jae Choi, David M. Harley, and James M. Wilson was described in “Geovisualizing Data with Ring Maps: Improves comprehension when mapping many variables [PDF],” which appeared in the Spring 2008 issue of ArcUser.] Ring maps use a basemap as the central feature, and surrounding rings represent the corresponding attributes in each location. Data that varies over time, such as weekly disease surveillance counts, annual cancer incidence/mortality, or monthly crime rates, can all be visualized using ring maps. Other data can be joined and used for exploring the potential contextual associations among the attributes.
Although a ring map is a powerful tool, there was no step-by-step tutorial describing how to make one. The authors developed a tool for creating a ring map in ArcGIS 10.1 using ArcPy and the Python language that can be accessed from ArcToolbox. The tool creates a ring map using a three-step process. The first step creates the number of rings specified by the user. The second step generates polylines that link the rings and the centroids of corresponding locations on the basemap. The third step creates an indexed column so that the attribute table for the ring map can be joined with another table, in this case cancer incidence data in a Microsoft Excel spreadsheet. As the number of rings increases, so does the computation time required.
Getting Started
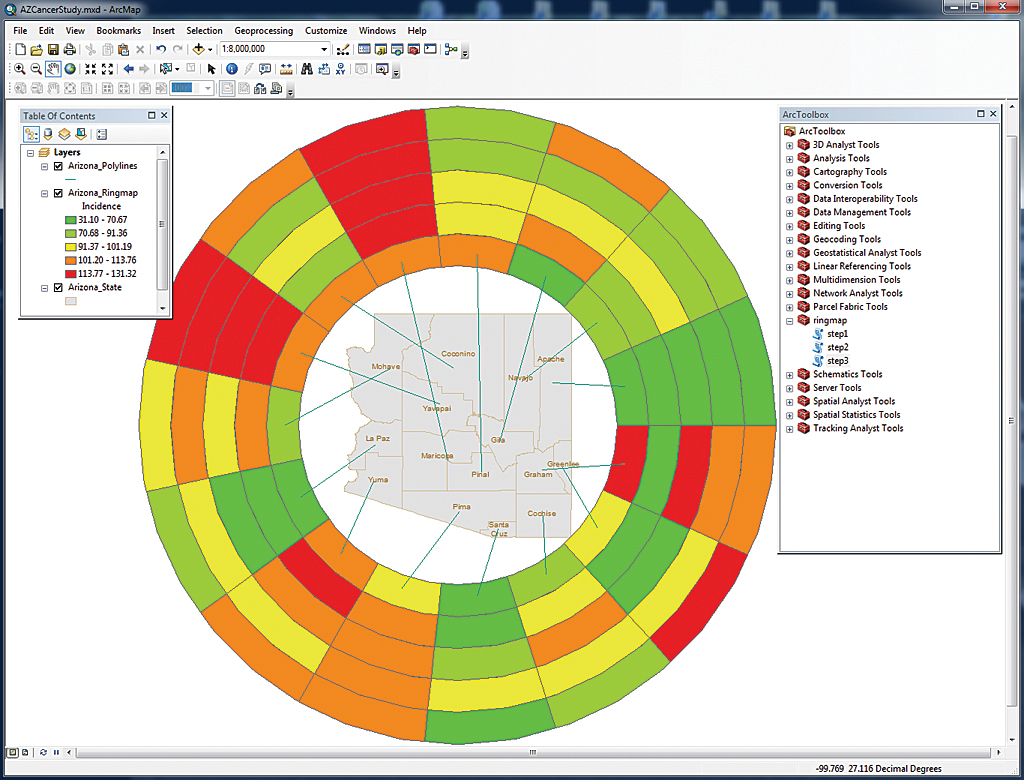
This exercise uses a sample dataset, containing both training data and the RingMap toolbox, which can both be downloaded from the ArcUser website [ZIP]. The data describes age-adjusted female breast cancer incidence from 2006 to 2010 for the 15 counties in the state of Arizona. It was obtained from the Arizona Department of Health Services. The five rings created correspond to the number of years considered in the study data. A shapefile of the administrative boundaries, downloaded for free from a public domain spatial database, Global Administrative Areas, is also included in the sample dataset.
After downloading the sample dataset and the RingMap toolbox, unzip it at or near the root directory of a local drive where it will create a folder called Ringmap_Tutorial.
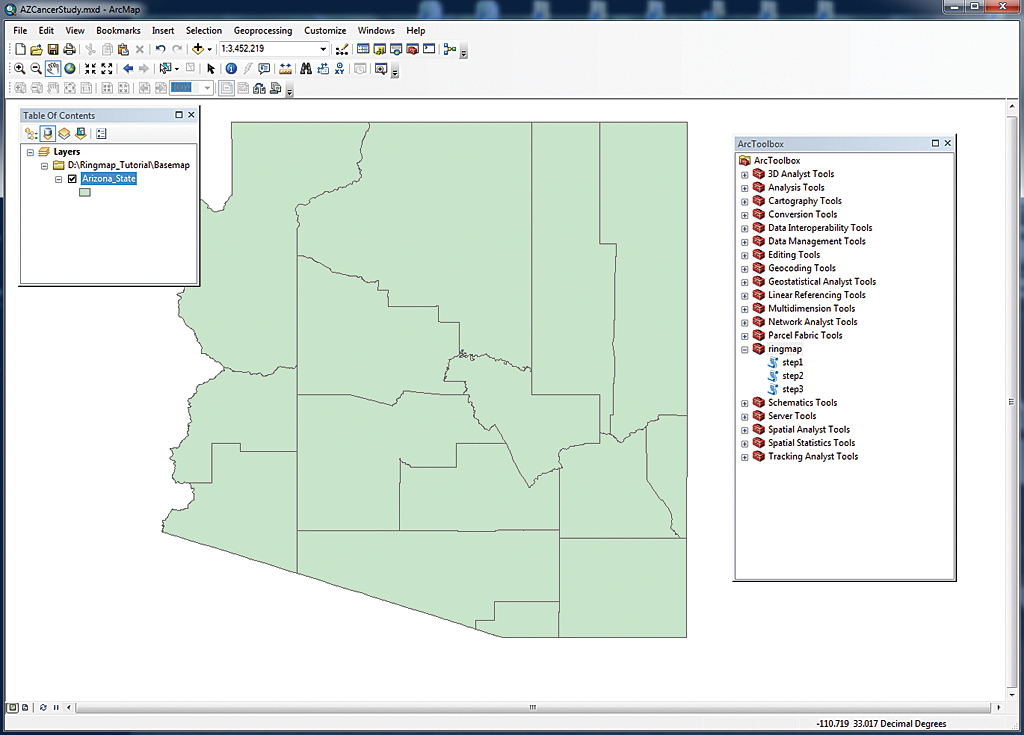
Start ArcMap and load the shapefile named Arizona_State.shp from the Basemap folder. Open ArcToolbox, right-click ArcToolbox in the ArcToolbox window, choose Add Toolbox, and select the toolbox named ringmap from the Ringmap_toolbox folder. The toolbox contains three scripts named step1, step2, and step3.
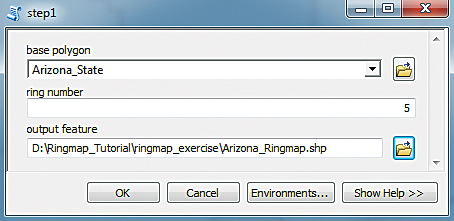
Click the step1 script to open it. In the script dialog box, choose Arizona_State from the drop-down for basepolygon. Enter 5 for the ring number. Set the output to the ringmap_exercise folder and name it Arizona_Ringmap.shp. [Make sure to type in the .shp file extension.] Click OK to create the five-ring polygon.
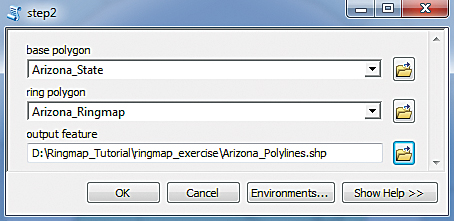
Click the step2 script. In the script dialog box, select Arizona_State from the basepolygon drop-down. Choose Arizona_Ringmap from the input ring polygon drop-down. Set the output location for line features that will be created to the ringmap_exercise folder and save it as Arizona_Polylines.shp. Click OK to run the script tool and create the lines that will link the ring map to the basemap.
Click the step3 script. In the script dialog box, select Arizona_State from the basepolygon drop-down. Choose NAME_2 (i.e., the county name) for the town field and choose Arizona_Ringmap as the ring polygon. This step creates the indexed column for joining attribute data. Click OK.
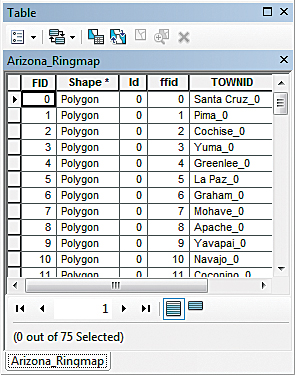
Once step3 has run, open the attribute table for Arizona_Ringmap in ArcMap. The TOWNID is composed of the county name and the order of the ring. Ring numbering begins with zero, so the index named Santa Cruz_0 is the first inner ring of the Santa Cruz county.
Add cancerdata.xls, the Excel spreadsheet containing cancer incidence data located in the Ringmap_Tutorial folder, to the map. Choose the table named data$.
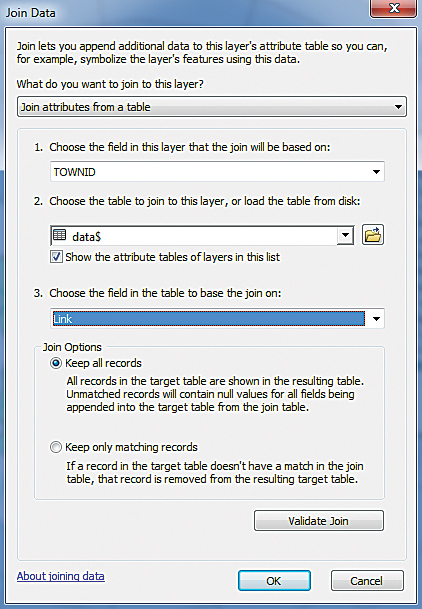
In the table of contents for ArcMap, right-click on Arizona_Ringmap and choose Joins and Relates > Joins. Join Arizona_Ringmap with cancerdata.xls by choosing TOWNID as the field the join will be based on, choosing data$ as the table to join and Link as the field in the table to use for the join. Click OK.
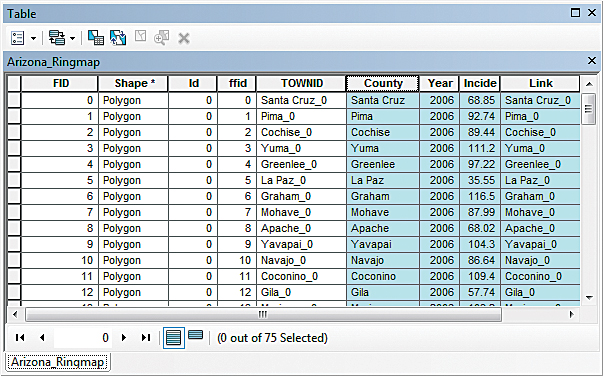
Reopen the attribute table for Arizona_Ringmap to verify that Arizona_Ringmap and cancerdata.xls have been successfully joined.
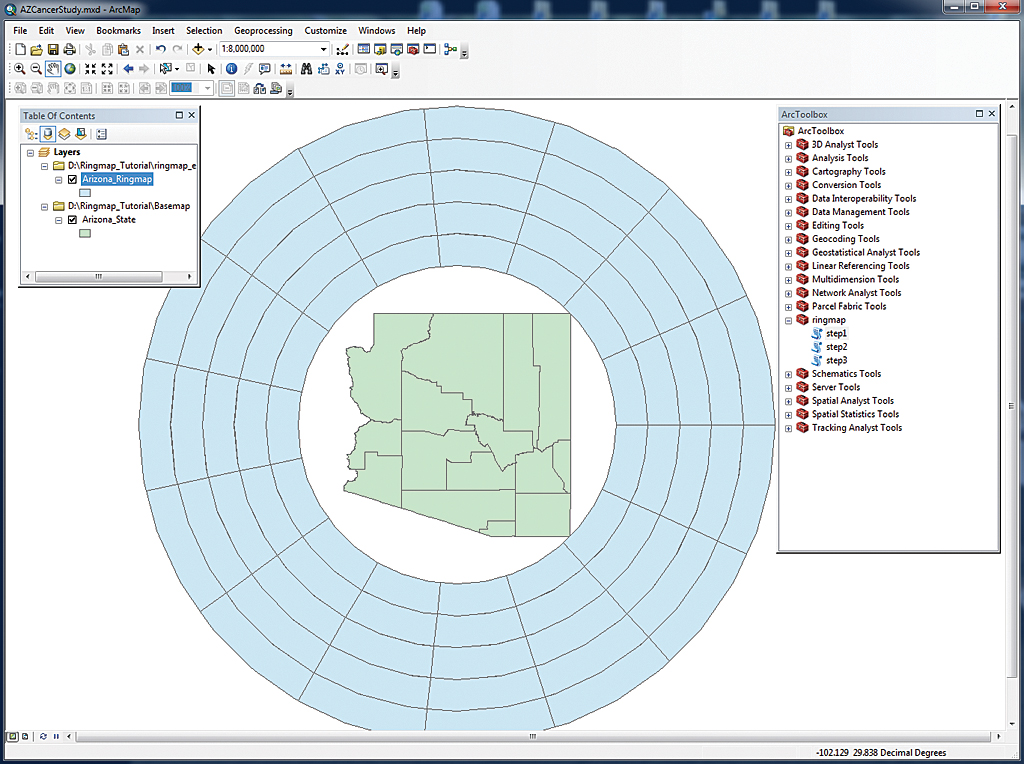
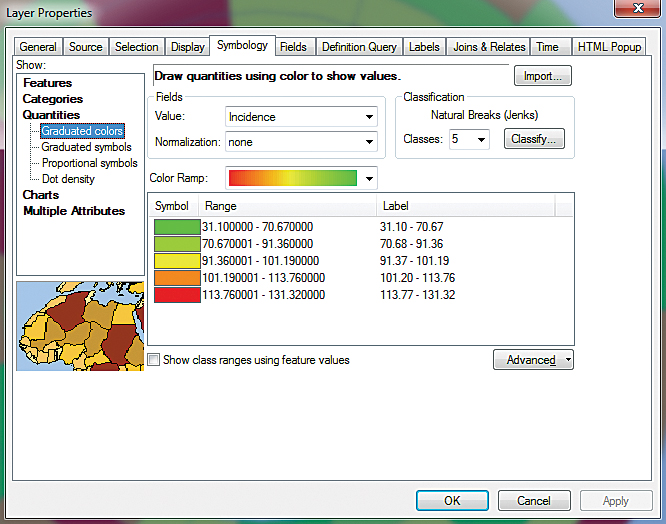
Double-click Arizona_Ringmap in the table of contents and choose the Symbology tab of the Properties dialog box. Choose Quantities > Graduated colors and set the number of classes to five and method to Quantile. Edit labels and apply a color ramp to symbolize female breast cancer incidence in Arizona for 2006–2010. The inner ring displays data from 2006, and the outer ring displays data from 2010. Apply county name labels and a pleasing color to Arizona_State.
For more information, contact
Dr. Ta-Chien Chan
Center for Geographic Information Science, Research Center for Humanities and Social Sciences, Academia Sinica, Taiwan
E-mail: tachien@sinica.edu.tw
References
Huang, Guilan, Sergio Govoni, Jae Choi, David M. Hartley, James M. Wilson, “Geovisualizing Data with Ring Maps [PDF],” ArcUser vol. 10 no. 2, 2008: pp. 54–55.
Stewart, J. E., S. E. Battersby, A. Lopez-De Fede, K. C. Remington, J. W. Hardin, K. Mayfield-Smith. “Diabetes and the socioeconomic and built environment: geovisualization of disease prevalence and potential contextual associations using ring maps,” International Journal of Health Geography 2011, vol. 10, no. 18, 2011.
Zandbergen, Paul A., Python Scripting for ArcGIS, Esri Press, 2013.
Arizona Cancer Registry Database Query Module Set Selection.
About the authors

Dr. Ta-Chien Chan