In his Keynote Address at the Esri 3D Mapping Forum, Nathan Shephard announced that 3D GIS has officially emerged and pervades across the Esri platform. Shephard, who leads Esri’s 3D visualization team, kicked off the conference, which was held July 12–13, 2014, in San Diego, California. In this interview, Shephard explains the distinction between 3D mapping and cartography and why Esri dedicated an entire forum to this technology.
Why did Esri dedicate a forum to 3D mapping?
3D is important for GIS users because our world isn’t flat, and some problems can only be solved when you include the z-coordinate. You can also generate excitement and improve communication by presenting your message with 3D scenes. Many of our users have been asking for more guidance and insight on working with 3D, so it made sense to start a community that can discuss and learn about this technology together.
What does 3D’s pervasiveness across the Esri platform mean for 3D content creators and GIS users?
Basically it means that 3D capabilities are more accessible across the platform than ever before. When you need to do 3D work, you can, regardless of where you happen to be in the platform. And for those who are unsure about 3D or have been worried about getting into it, having it available in places where you’re already comfortable will make it less imposing. The goal is that 3D will be more attractive to people, regardless of their GIS expertise or where they happen to fit into the platform.
In the Plenary Session, you also talked about Esri’s 3D City Information Model (3DCIM) and standardization. What are some of the benefits of working with that model?
The attraction of standard data models, like the 3D City Information Model, is the reward users get by following it. They get preauthored maps, preauthored scenes, well-defined analytical and data management tools, and all just by modeling their data with the 3DCIM. And because it’s built on information and knowledge gathered from previous projects, it has significantly reduced risk when diving into new projects.
Where do you see 3D mapping headed now that it has emerged and what does the market look like?
There’s no stopping it. It used to be that some people would add 3D as a differentiator or kind of gimmick. But now it’s more a case of it being expected. This means that, in general, people are rolling more and more 3D into their general workflows, even if they were only 2D just a few years ago. There are billions of dollars in projected growth coming from this technology. I think that kind of speaks for itself. The pieces are in place to start doing this work without the obstacles and impositions that existed before.
There was a lot of talk about web scenes at the forum and what’s next. Can you tell me how they’ve evolved?
The primary new addition to the web scenes is the ability to consume services, which means we can have web scenes of any size. Web scenes are also becoming a larger part of our story across the platform. You can author them in ArcGIS Pro, or you can author them on the web. Then you can consume them in ArcGIS for Desktop, ArcGIS Runtime, or the web. Basically the delivery mechanism for 3D content centers on the web scene. You author, host, and manage web scenes and the services that they’re displaying, and then you use that across the platform as needed. Whether it’s for data management or analysis or just communication, web scenes are becoming a focused integration point for sharing 3D.
In your plenary talk, you distinguish between the 3D photorealistic scene, such as the kind you’d see in the web scene of a city, and the cartographic, thematic view. Will we see more of these 3D cartographic views to communicate information in the near future?
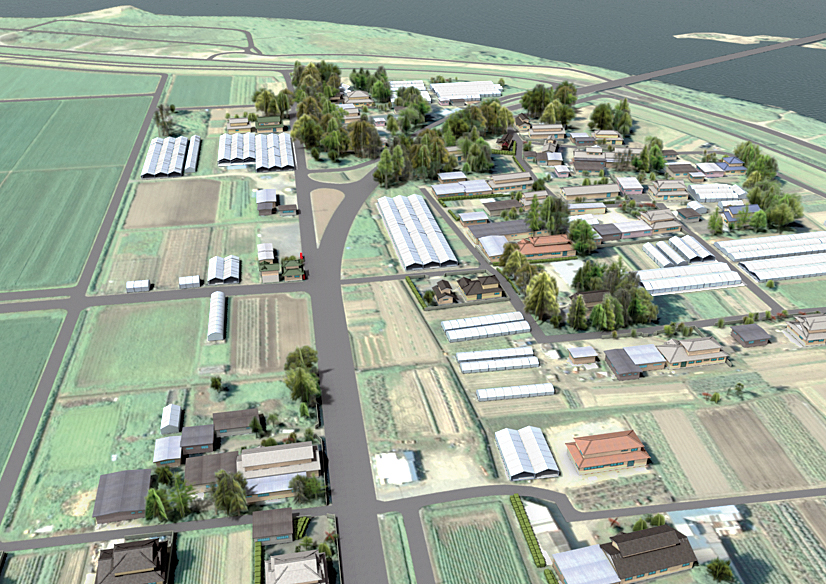
I really hope so. In my talk I used the adage, “An aerial image is not a map.” Certainly, an aerial image has a purpose; it can show you where things are right now, and there are use cases for this. The same applies to a photorealistic 3D scene. It can show you what the city looks like right now. You can swap out a building and see what it’ll look like after a new building comes in. That’s a valid and useful reason to create a photorealistic scene.
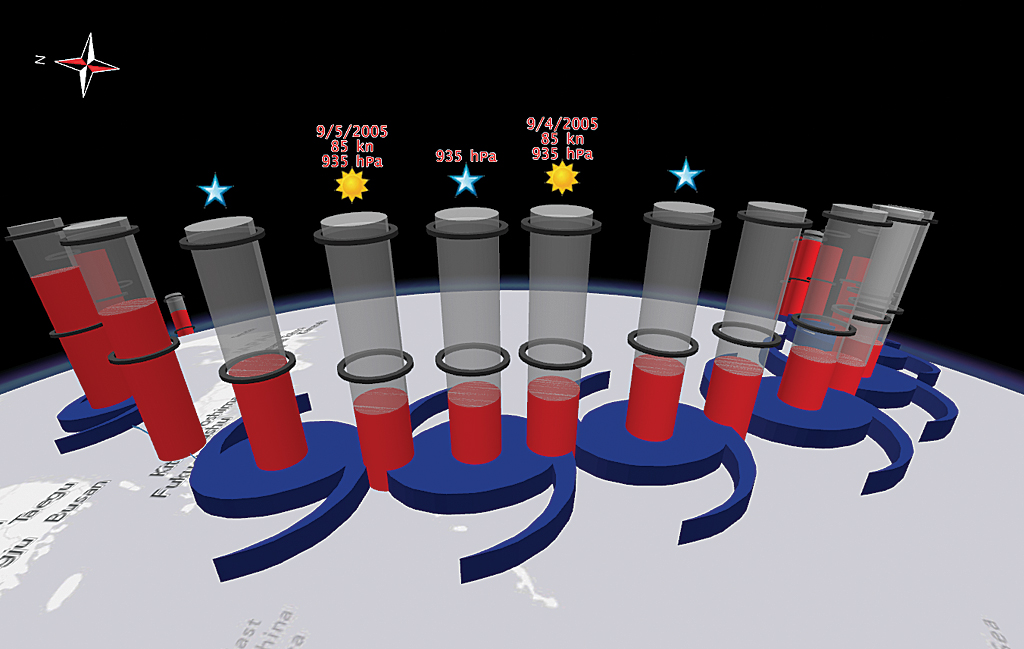
But there are many other cases where a thematic view can engage and provide a lot more information to an audience. Crime statistics, typhoon dynamics, subsurface geology—all of these things need different ways of being presented because of their inherent complexity. Right now, I think using thematic and cartographic representations of 3D to help understand things such as natural phenomena and social problems is the least exploited aspect of 3D mapping. I hope more and more users take advantage of this in the future.