The Department of Transport and Main Roads (TMR) in Queensland (Australia), modeled the economic impacts of unplanned road closures to support investment decisions across the state-controlled road network.
With many competing demands, fiscal and physical constraints, and potential risks to the assets operation, making decisions about where to invest in road operations intelligent transport systems (ITS) infrastructure can be challenging.
Road operations ITS infrastructure is electrical- and communications-based technology that provides enhanced operation, efficiency, and safety of transport infrastructure through monitoring, informing road users, and controlling road use. ITS examples include variable messages (VMS), lane use management systems (LUMS), road condition information signs (RCIS), and various sensing and monitoring tools including closed circuit television and flood monitoring.
The road network controlled by TMR has a combined length of more than 33,000 kilometers (20,500 miles), which is divided into 2,200 separate segments based on annual average daily traffic (AADT) characteristics. This network includes high-density urban areas with high traffic volumes that run at capacity during peak periods. The network also encompasses mountainous landscapes with challenging road corridors to remote communities and isolated areas that are of strategic importance.
Queensland also encompasses many climatic regions, from coastal tropical areas to inland deserts. The combination of network characteristics and variable climatic conditions with an extremely distributed population and a landmass almost three times the size of Texas but only one-fifth the population makes the location aspect of investment prioritization very important.
TMR partnered with Arup, an independent firm of designers, planners, engineers, consultants, and technical specialists, and EY (Ernst & Young) to develop a spatial framework to assist in identifying road segments of interest for ITS infrastructure investment. As it is essentially answering the spatial question of where to prioritize investment, ArcGIS was chosen as a key technology platform to develop this spatial framework.
The results were fed into an economic model that calculated the annualized financial impact of unplanned road events on the Queensland economy and provided to TMR to assist with investment decisions across the state-controlled road network.
Spatial Framework Structure
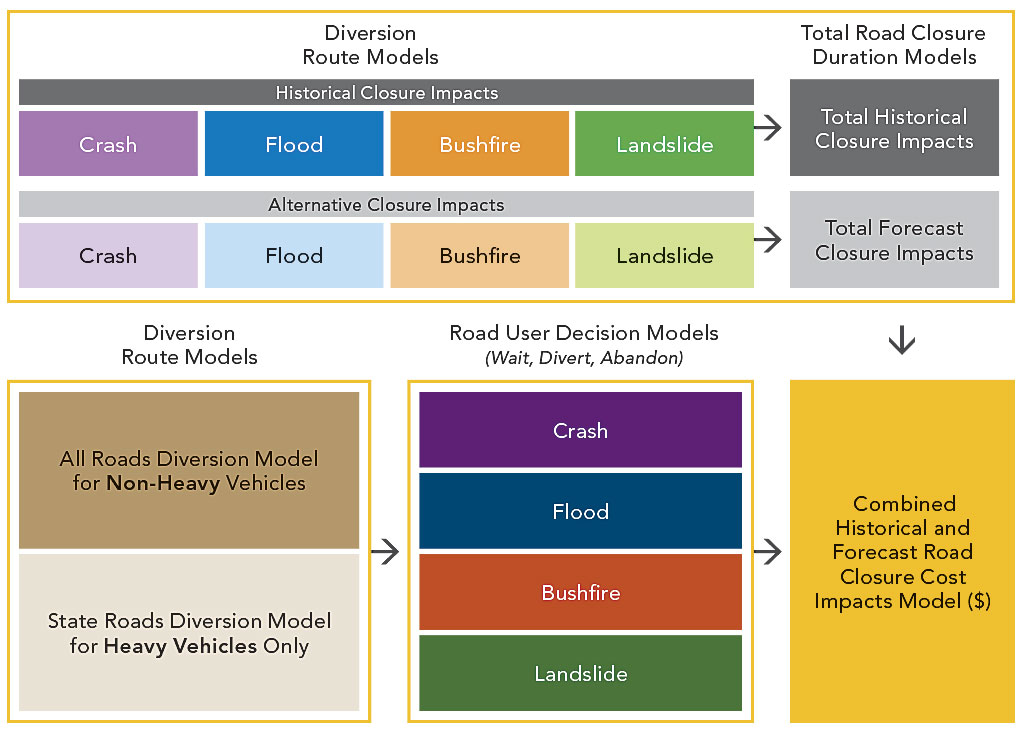
The first part of the framework was based on quantifying how long road segments are closed from unplanned events, specifically crashes, bushfires, landslides, and flooding. From the assessment of each of these criteria, the total annualized closure duration can be determined.
The second part of this framework was modeling diversion routes for each of the 2,200 road segments. When a road segment is closed, vehicles will likely be diverted to other roads. Modeling these diversions and the increase in time and distance for each diverted vehicle allows for a more accurate representation of the impacts to the Queensland economy.
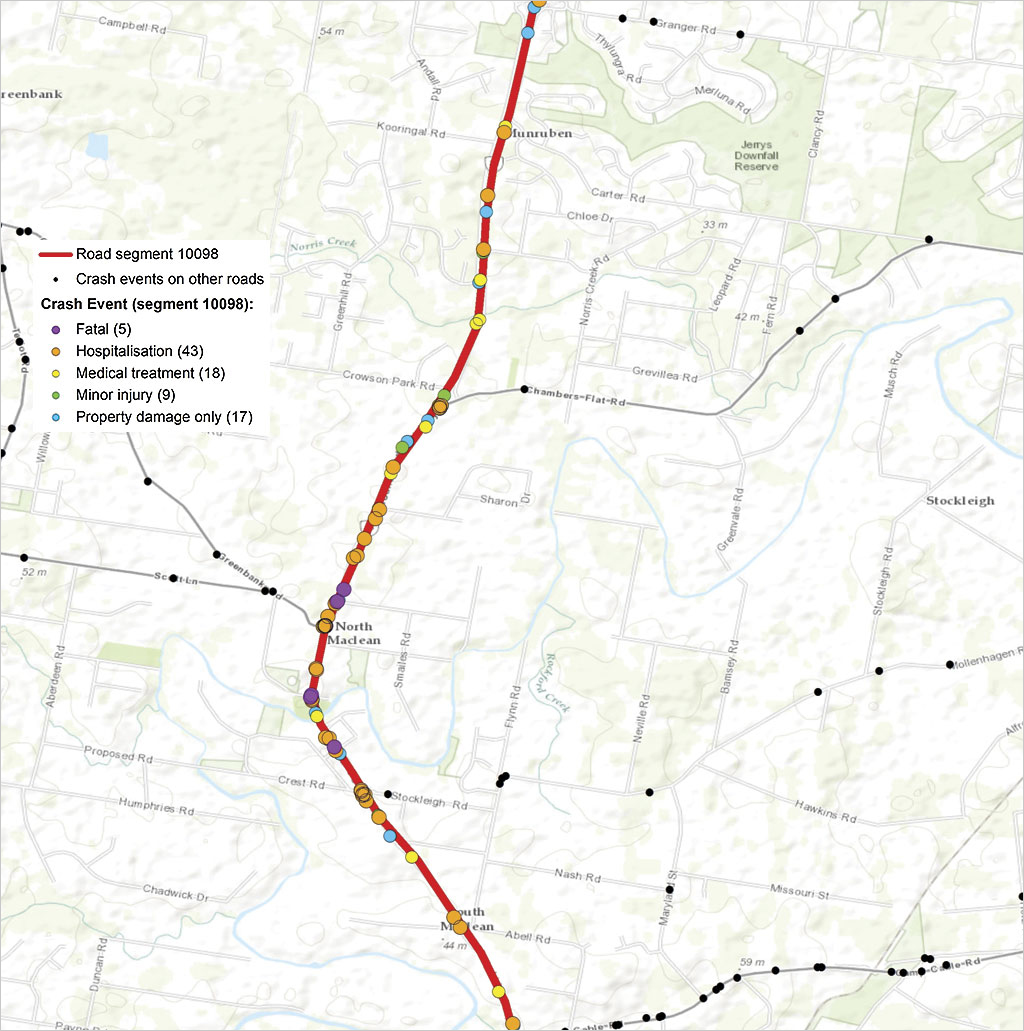
TMR maintains multiple databases that capture data for road closure events including these four criteria: date, location, duration, and closure description. The key to this project is the ability to take individual closure event data and spatially summarize by road segment extent. The range of analysis tools made ArcGIS the ideal platform for this analysis.
Each of the four criteria was assessed to provide a summary for all road segments. The summary statistics included the average closure duration caused by an event, the average number of closure events per year, and the average total duration of road closures throughout a year. Once this data was produced for each criterion, the information was aggregated to produce a total closure duration profile for all state road segments throughout Queensland.
The road closure event databases provided a detailed assessment of road closures for the previous five years. Some of the criteria in this framework have longer-term trends that won’t be picked up within this time frame, and some road segments were overrepresented or underrepresented by closure events within the five-year data sample. Consequently, a second part was added to the framework to calculate alternative closure duration estimates for each road segment.
Instead of being based solely on databases of historical road closure events, the alternative method was based on industry-accepted assumptions and rule-based assessments. This alternative method used the same criteria—crashes, bushfires, landslides, and flooding—and produced the same type of results as the historical assessment method: the average closure duration caused by an event, the average number of closure events per year, and the average total duration of road closures throughout a year.
To summarize the spatial analysis methods of this framework, the historical road closure model primarily uses geometry-based analysis (i.e., assessing road segment polylines against locations of road closure event features). The alternative road closure model uses attribute-based analysis (i.e., applying rules and formulas based on road characteristics data within the road segment attribute tables). The historical and alternative results can be compared with each other, demonstrating the analytical capabilities of ArcGIS.
The Impact of Diversions
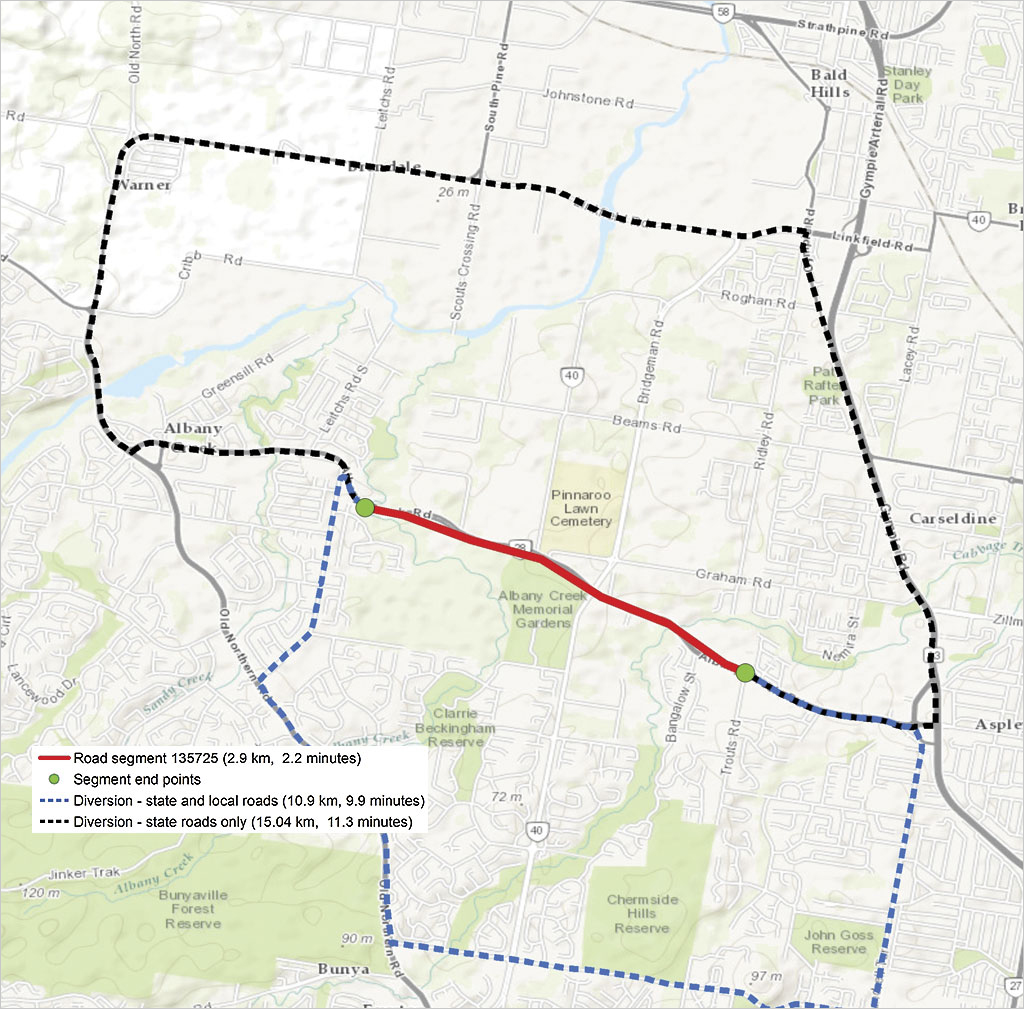
To properly understand the impact of road closure events on road users, more than just quantifying road closure duration is needed. When a closure event occurs, road users will either abandon their trip, wait, or divert around the closure to continue their trip. So modeling the distance and travel time of diversions around each road segment is a key aspect of this framework that will measure the significance of a road segment. Larger diversions have a greater economic impact on road users.
Developing a single ArcGIS Network Analyst scenario to calculate a route is a simple task. Using a network analysis layer, set the endpoints of the route (endpoints of the road segment). To model the road closure, a barrier is included along the road segment. This results in a route based on alternative alignments to the road segment itself.
The challenge was to create and solve this scenario separately for all 2,200 segments. Because the network scenario must be developed separately for each road segment, the solution requires iterating through each road segment, building each network routing scenario, and then calculating the solution.
In addition, diversions for light and heavy vehicles needed to be modeled separately. Light vehicles can divert along any road, but heavy vehicles will only divert along larger, state-controlled roads. This meant calculating two diversion routes for each road segment, resulting in calculations for a total of 4,400 separate diversion routes.
The overall solution for modeling road segment diversions can be created by integrating ArcGIS Network Analyst tools with ModelBuilder iterators. This allows the network analysis scenarios to be built separately and solved for all road segments as part of a single model run. The output from the model was a feature class of all diversion route polylines with statistics for the diversion distance and travel time. The travel time was based on speed assumptions for all road hierarchy types.
The main steps for creating an iterative network analysis model are similar to manually performing the analysis for a single network scenario. This process includes
- Adding an iterator that will run through each road segment polyline in the workspace.
- Building the scenario with all relevant elements using the Add Locations tools from the Network Analyst toolbox. For this project, the scenario elements were the road segment endpoints (start and end of the route) and a barrier polygon that represented the road segment closure. The polygon was created by clipping a section of the road segment polyline and buffering it by an appropriate distance.
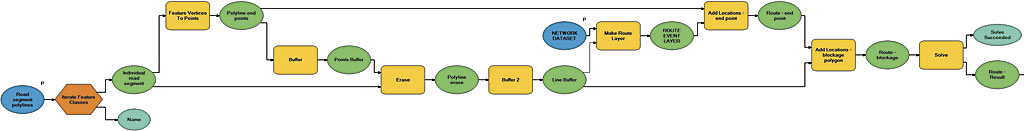
Solving the Scenario
Other considerations when creating an iterator-based network analysis model include saving the results to a geodatabase once the scenario has been solved and using in-line variable substitution to ensure the resultant feature class is named based on the feature variable from the iterator.
With both historical and alternative road closures and light and heavy vehicles route diversions modeled in GIS, the results were fed into the economic impact model so EY could calculate the financial costs to road users from road closures.
Results and Conclusion
GIS is an ideal tool for holistically modeling road closure impacts throughout Queensland. The ability to analyze road segments in terms of proximity to surrounding features is key to modeling road closures from a large array of base datasets.
ArcGIS came into its own when performing the diversion route modeling. The ability to calculate diversion routes using ArcGIS Network Analyst tools was important to producing accurate results. Linking analysis tools with a ModelBuilder iterator allowed routing calculations to be performed over all road segments in a single model run.
This linkage between ArcGIS Network Analyst tools and ModelBuilder iterators greatly enhances the potential for network analysis. Instead of creating and solving a single network scenario, any ArcGIS Network Analyst calculation can be performed across many features.
What also became apparent during the development of this framework is its potential to be implemented across various infrastructure network types. Governments currently must work with limited budgets to maintain and upgrade infrastructure networks. GIS can assist with infrastructure funding allocations. As shown by this project, GIS can provide a consistent and impartial assessment of whole infrastructure networks (and perhaps across multiple networks) that will provide the foundational information required for complex investment decisions.
Furthermore, this project highlighted the value of agencies maintaining comprehensive datasets that represent different facets of their business. Because TMR maintains multiple in-house databases and many datasets that are publicly available through the Queensland government open data policy, the barriers to undertaking such analysis and achieving information-driven decisions have been significantly lowered.
For more information, contact Greg King.