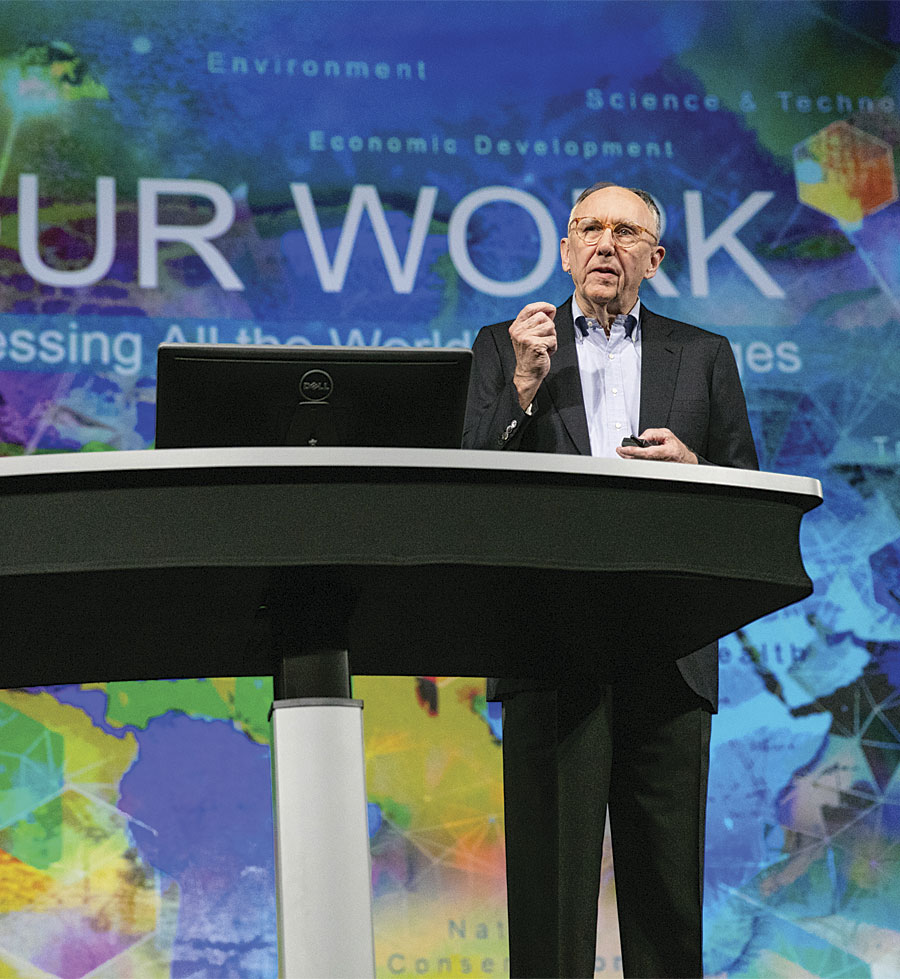
“Your work is so interesting,” Esri president Jack Dangermond told an audience of 16,000 people during the Plenary Session at the 2016 Esri User Conference. “You are working on virtually all the significant challenges and issues on the planet, from climate change to food production to humanitarian relief to making cities better.”
“Smart GIS…is about integrating everything—connecting people and processes and things and all the data about them,” noted Dangermond. “Smart GIS, for me, also means being able to engage communities.”
Throughout the Plenary Session, Dangermond welcomed speakers from organizations that were using GIS to integrate data, create information, and make better decisions.
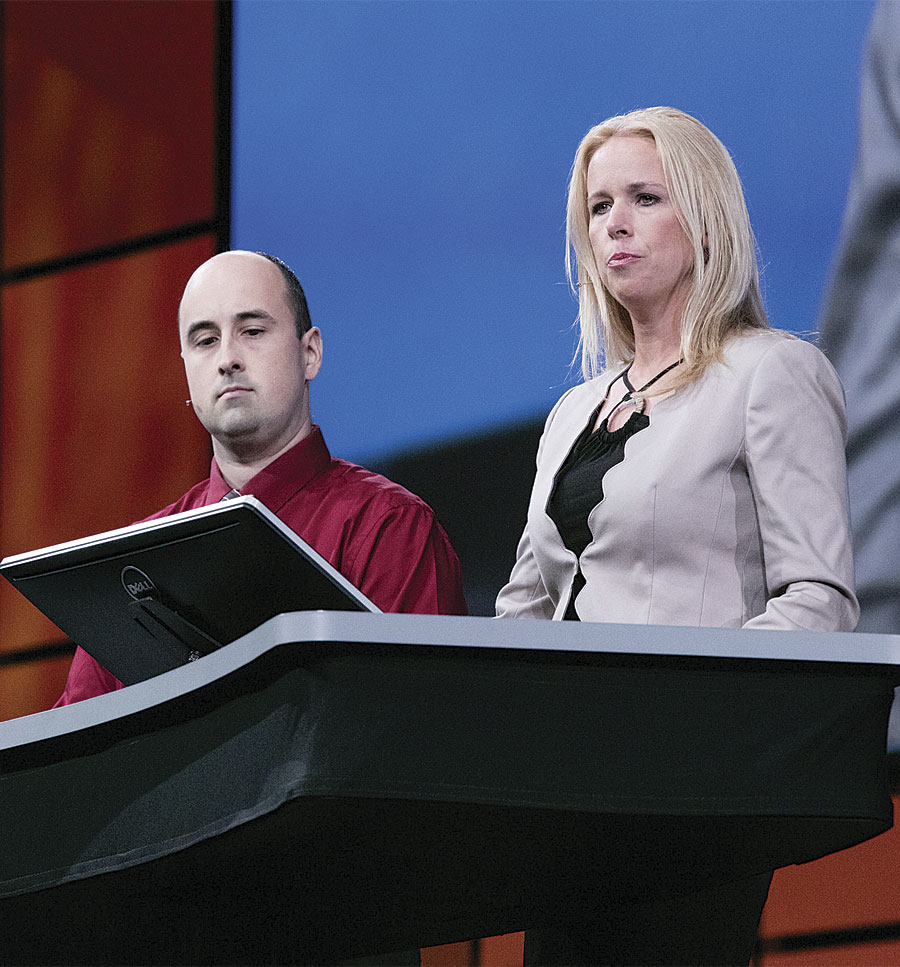
That’s what the City of Los Angeles, California, is doing. Lilian P. Coral, chief data officer for the Office of Mayor Eric Garcetti, described the city’s GeoHub in her plenary presentation. GeoHub brings data stored in different city departments together and provides an online public platform with ready-to-use apps that encourage residents to use this data. [Read more about GeoHub in “Harnessing the Power of Geotechnology” in the spring 2016 issue of ArcUser.]
The City of New Orleans, Louisiana, is using GIS to make smarter decisions about where to build. By bringing together information about the community in a map that uses soil permeability, wetlands, and historical flood zones, policy makers can see areas where the ground is highly absorbent and likely not ideal for development.
“Using this map, we can think in completely different ways about how we build our environment and our neighborhoods,” said Lamar Gardere, the city’s chief information officer.
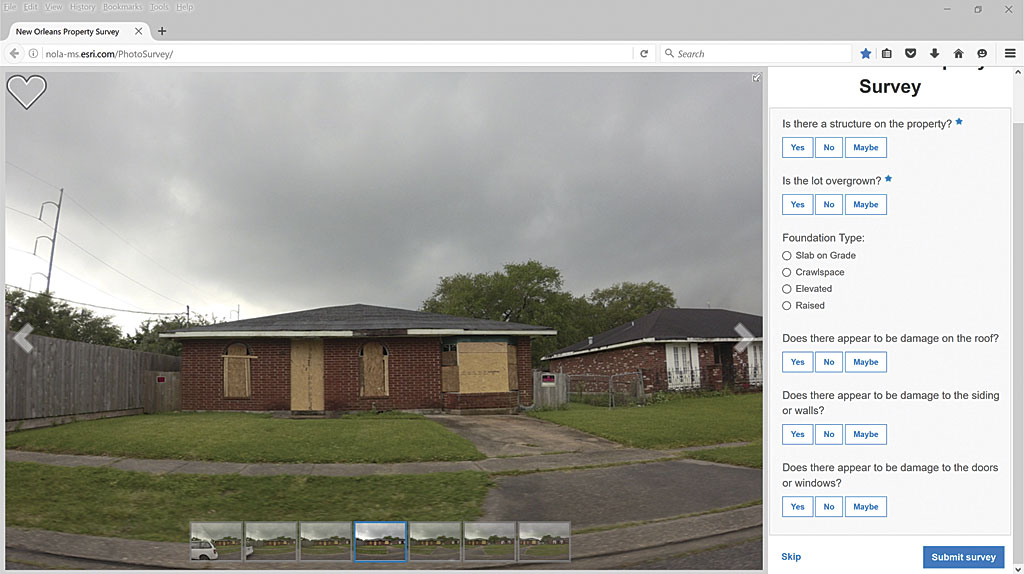
Gardere also exhibited the city’s BlightStatus crowdsourcing web app, which not only educates residents about the blight remediation process but also enlists their help. The city collected street-level photos of every parcel in New Orleans and created an app that lets anyone online evaluate these properties for blight based on what they see in these photos by filling out a six-question survey. Having a baseline on blight before hurricane season helps New Orleans tremendously with recovery efforts.
“Running frequent surveys will give us a reliable layer of vacant lots and foundation type, giving us a sense of our housing resiliency,” said Gregory Hymel, the GIS director for the City of New Orleans.
Using GIS, Guy Carpenter, one of the world’s largest reinsurance brokers, helps its customers—insurance companies—intelligently manage claims and assess risk. Guy Carpenter used ArcGIS to visualize which neighborhoods were impacted by a massive wildfire in Fort McMurray, Alberta, Canada, earlier this year that destroyed 2,400 homes and buildings and forced more than 80,000 people to evacuate. By pinpointing individual homes destroyed by the fire, Guy Carpenter could enable insurance companies to estimate losses, prepare for expected claims, and put the resources in place to assist policyholders.
Esri unveiled a map that takes smart to a whole new level. The new Green Infrastructure map, along with its apps and tools, will help organizations in the United States design green infrastructure plans that will enable better planning decisions on a larger scale. The map includes all intact natural areas within the continental United States that are larger than 100 acres, regardless of ownership or preservation status. The map includes land cover (forests, developed land, land cultivated for crops, herbaceous and woody wetlands, and barren and scrubland) and the location of agricultural areas, ridges, and valleys. (See “Ensuring a Better Future” in this issue.)
“It’s a series of methods and a series of tools that you [can use to] craft your own plans,” said Dangermond. Since each community’s plan would be unique and would require citizen engagement, Esri is providing the datasets and other resources for people to use at local, regional, and urban scales.
Green infrastructure mapping will show where the most valuable landscapes are before development occurs to preserve rivers, tributaries, critical habitat, wetlands, flat plains, and prime agricultural land and how they connect developed areas. Decision-makers can then identify how proposed new projects and urban growth will potentially impact existing natural resources.
“Geography, mapping, [and] GIS have never been so important,” said Dangermond. They provide “the language of understanding of our world and…a platform for creating a better future.”
With GIS continually getting smarter, humans today are aware of things they couldn’t have known before—things about the built environment, about nature, about the planet. That engenders a different kind of understanding about the world—and that is just what Richard Saul Wurman, founder of TED Talks, wanted the audience to contemplate at the end of the Plenary Session.
“I’d like you to think about how you personally understand things,” he prompted. “Don’t measure yourself by what teachers or parents or others tell you…that this is the only way you can do things.”
Instead, he urged attendees to figure out how they each go about understanding things. It will be different from person to person, he said, but he gave everyone “permission…to embrace that idiosyncratic, human way each of us understands things.”
Because, just as GIS cultivates new understanding, so do different ways of understanding create a better, smarter world.