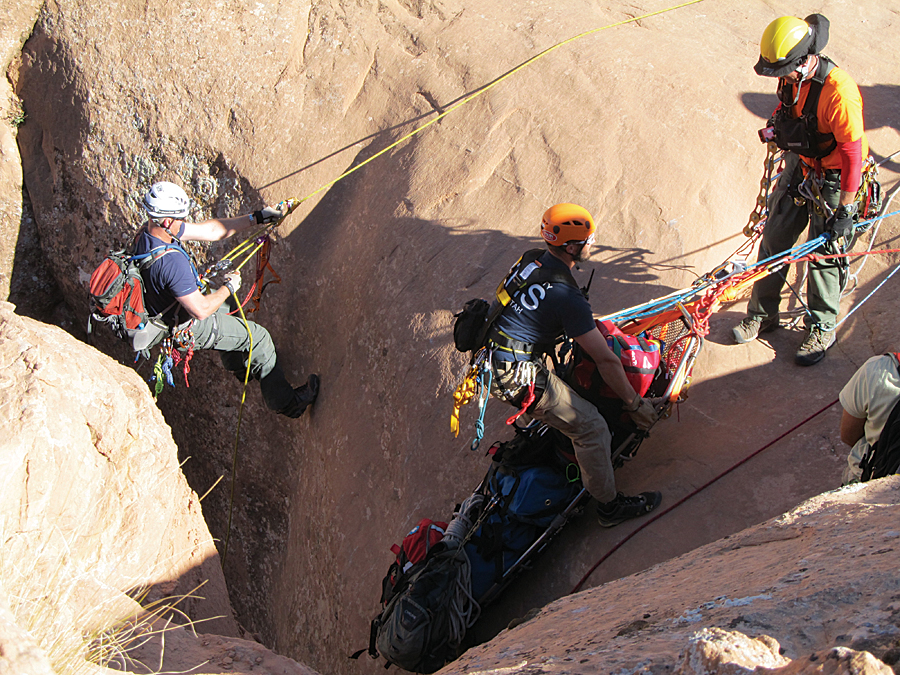
Learn techniques for modeling time and distance travel on a multimodal network using ArcGIS Network Analyst. This exercise continues the saga of an emergency response team responding to a fictional incident on the Slickrock Bike Trail located just outside Moab, Utah, that began in the fall 2013 issue of ArcUser Magazine in “Creating and Deploying a Multimodal Emergency Response Network.”
The previous exercise showed how to create and test a multimodal network dataset that could be used for defining and accumulating emergency response personnel for wildland search and rescue (SAR) and emergency medical services (EMS) response. In this hypothetical incident, the homes of volunteer SAR and EMS personnel were mapped and routes from homes to assembly points were mapped to determine if sufficient personnel were available to effectively initiate and conduct a typical response.
This exercise will show modeling techniques for routing responders and safely transporting an injured mountain biker to appropriate medical treatment. Many of the components developed in the previous exercise will be used in this exercise. The previous Slickrock exercise applied certain assumptions to estimate response times. This exercise will use some of those assumptions and base many of the procedures in this exercise on actual response data.
However, use the network dataset provided in the sample dataset, which has already been prepared and tuned. A hypothetical dispatch record will guide mapping of the response efforts using the ArcGIS Network Analyst extension.

This exercise begins by routing SAR and EMS responders to their base facilities in and near Moab then along the Slickrock Trail to the hypothetical victim’s location. SAR personnel will be tracked as they respond and transport the subject to a medical facility.
Reviewing SAR Locations
To begin this exercise, download the sample dataset [ZIP] and unzip it on a local drive in a separate folder from any previous exercises in this series.
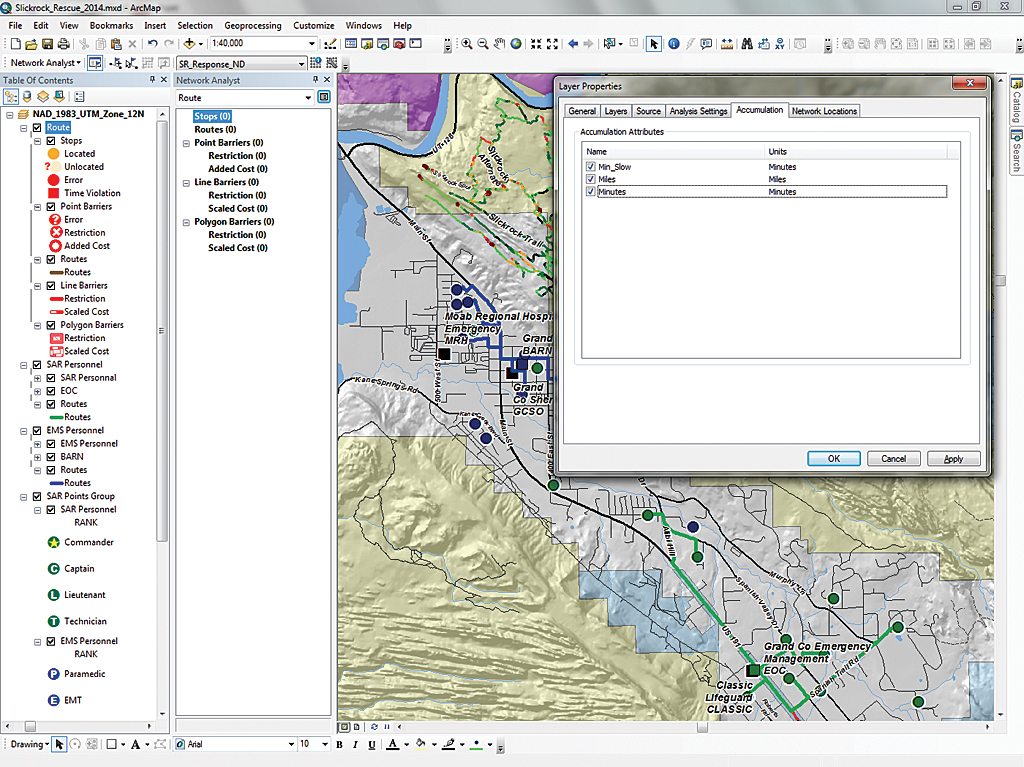
- Start ArcMap 10.2 and open Slickrock_Rescue_2014.mxd, located in \SR_Rescue\.
- Inspect data layers and note the data sources. The map initially loads at a scale of approximately 1:40,000, but because it is in data view, not layout view, the actual scale will likely vary.
- Choose Bookmarks from the Standard menu. There three bookmarks for 1:40,000-, 1:25,000-, and 1:15,000-scale display. (If the data extent does not match exactly, type the proper value in the scale window.) At 1:40,000, the entire study area will be displayed.
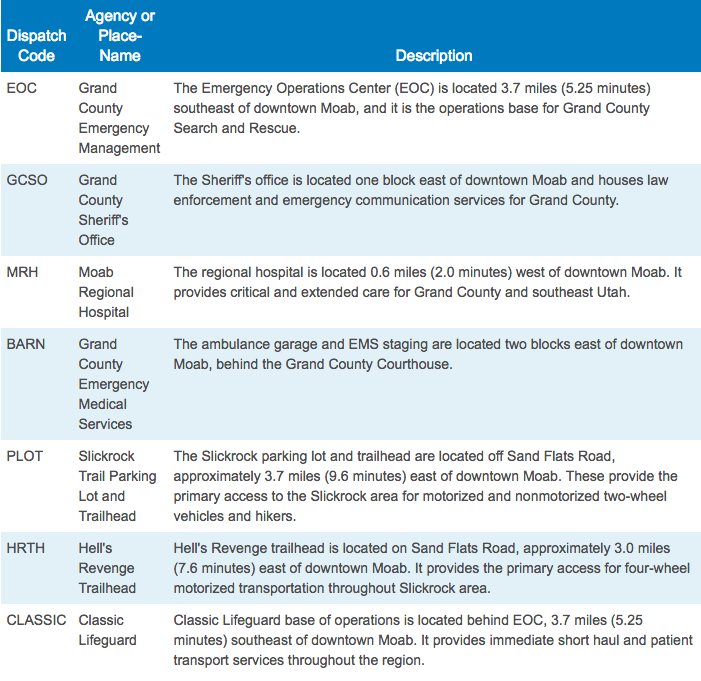
- Right-click on the SAR Locations layer and open its attribute table. There are seven SAR locations, and each includes a short label [Label] and a longer label [LOC_NAME]. The dispatch logs will reference each point using the [Label] field. Table 1 provides additional information about each point.
Reviewing Responder Routes
- Change the table of contents (TOC) display to List by Sources and look at the sources for the point data in the SAR Personnel and EMS Personnel Network Analyst layers.
- Activate the Network Analyst extension. Display the Network Analyst toolbar and dock it.
- Open the Network Analyst window. Explore the travel routes for each of the SAR and EMS personnel by clicking on each one.
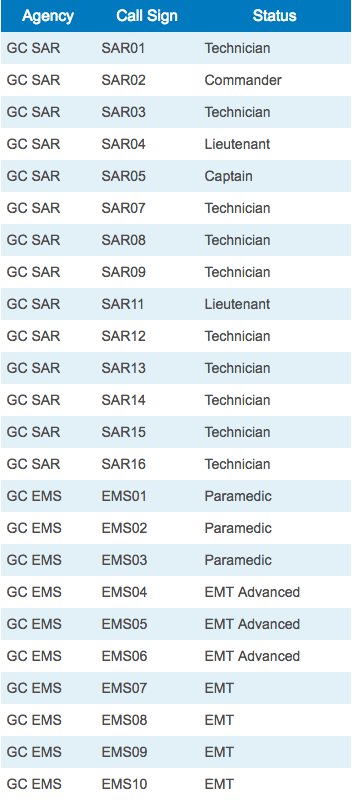
- The previous exercise used a Closest Facility solver to determine ideal arrival order for eight SAR personnel and six EMTs. This exercise will use earlier findings and calibrated dispatch logs to establish availability and response times. Get familiar with the call signs in Table 2. They are coded in the [Label] field for all response personnel, and they will be used throughout the exercise.
- Save the project.
Creating a SAR Locations Response Template
During an emergency, there is never enough time to carefully perform all necessary tasks. Creating a Route template for all SAR locations will improve this situation.
This template can be quickly copied and response points added and deleted before calculating routes. Actual Slickrock incident response logs were used to calibrate response times for the Slickrock Trail and Jeep Trails networks. Two times were calculated: one for quick response to a victim (Minutes), and the other for slower return travel while transporting (Min_Slow) the patient. Both times will be used to model the incident. By analyzing 12 recent Slickrock responses, it was determined that typical travel times out to an incident are approximately 25 percent faster than patient transport times.
-
- Click the Network Analyst drop-down in the toolbar and select New Route.
- Open the Route Layer properties. Under the General tab, rename the Route as Response Route Template.
- Click the Accumulation tab and check Min_Slow, Miles, and Minutes. Click Apply.
- Right-click Routes under the Response Route Template, choose Properties, and click the Symbology tab. Change the route color to a bright color and enlarge it to at least two points.
- Within Stops, change the Located symbol to a similar bright color. When using copies of the route template, the color of Routes and Stops can be modified to represent specific agencies.
- Because Network Analyst sets colors by default, they should be updated when using the template. Leave the Response Route Template at the top of the TOC and select it in the Network
- Analyst window to make it the current Route solver.
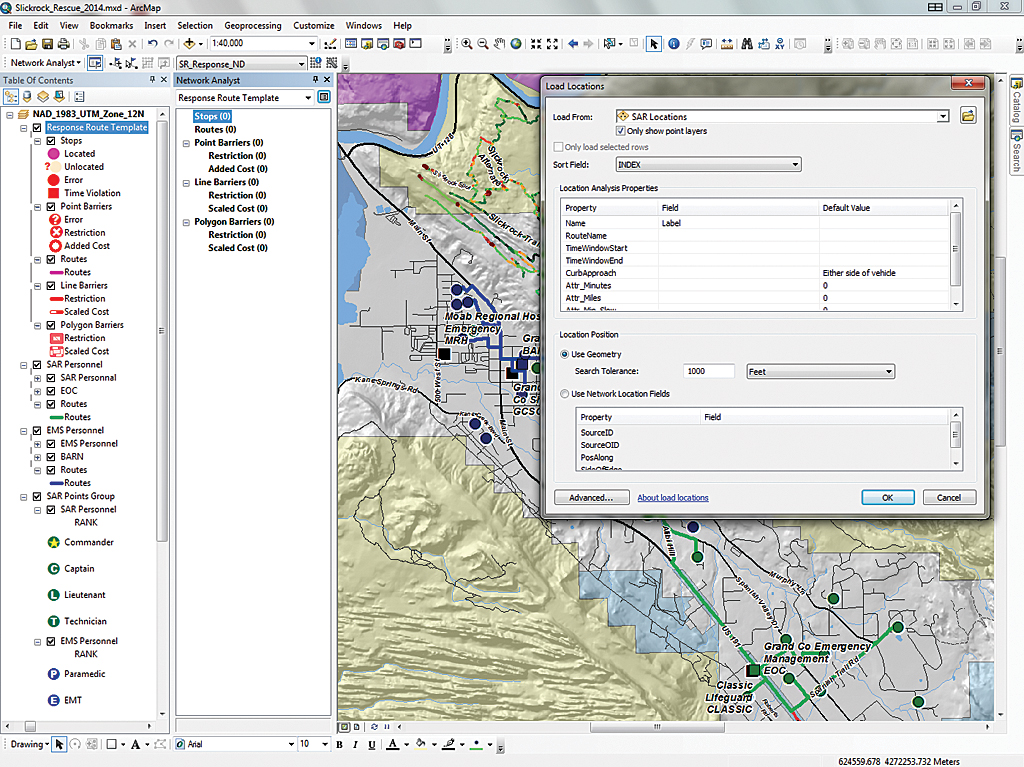
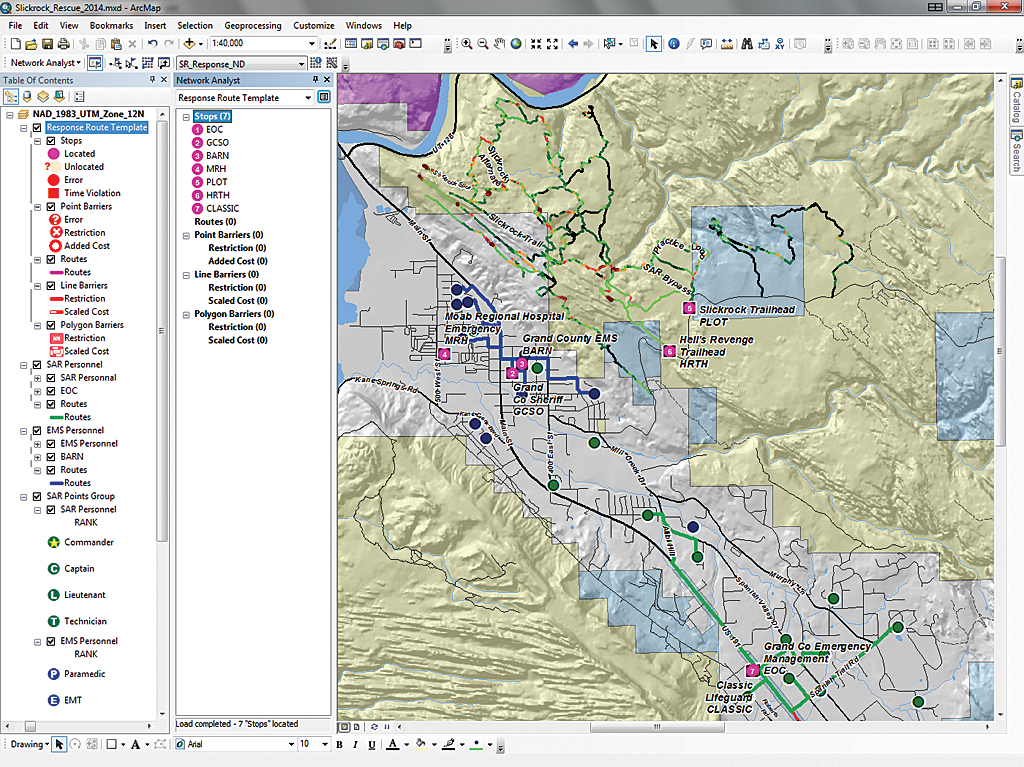
Right-click Stops and choose Load Locations. In the Load Locations dialog, set:
Load From: to SAR Locations
Sort Field: to Index
Search Tolerance: to 1,000 Feet - If all seven points do not load, create a new Route solver. This is very important so proper indexing is retained and the tolerance distance is increased. (A wildland search tolerance must often be much higher than an urban search tolerance.)
- Save the project before copying the template.
Using a Template to Create Many Routes
- In the TOC, right-click Response Route Template and select Copy from the context menu.
- Right-click the data frame name (NAD83_UTM_Zone_12) and select Paste Layer(s). Repeat this step at least twice to create a set of four or more routes.
- When finished, hold the Ctrl key to select all four new copies of the Response Route Template.
- Right-click any single selected template, choose Group, rename this group Response Route Group, and leave it at the top of the TOC.
- Rename the two topmost templates. Call the first on SAR Response to PLOT and the second EMS Response to PLOT. (Remember, PLOT is the dispatch code for the Slickrock Parking Lot.)
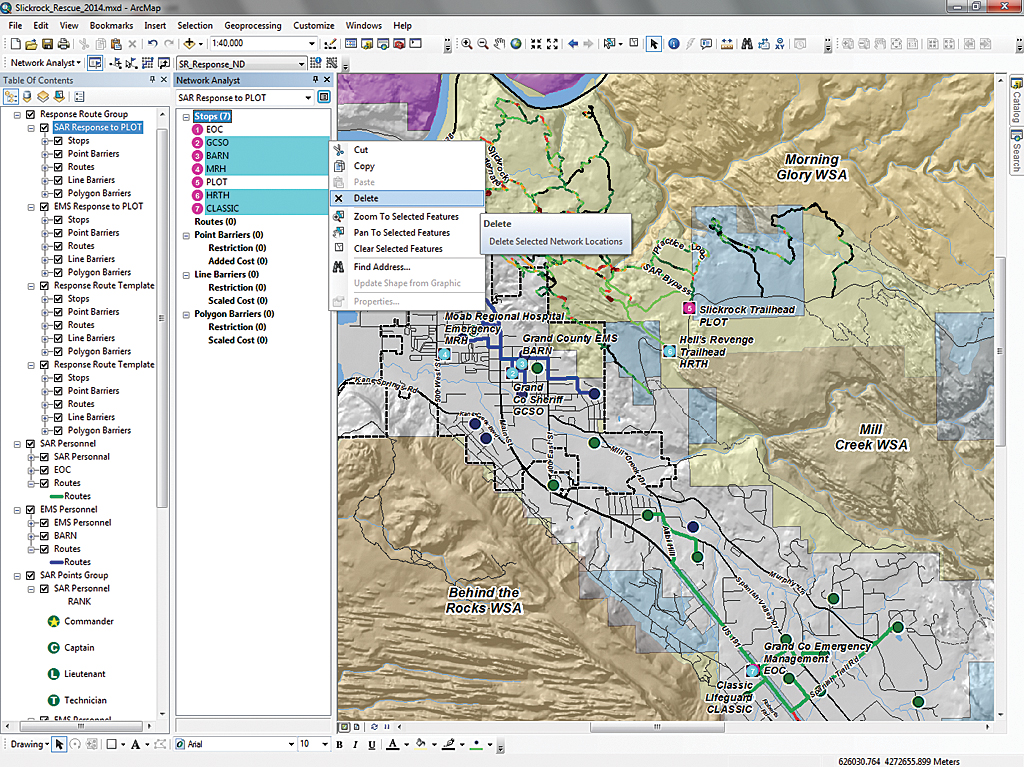
- In the Network Analyst window, make SAR Response to PLOT the active route. Under Stops, hold the Ctrl key and select all points except EOC and PLOT.
- Right-click any selected point and select Delete. Repeat this process for EMS Response to PLOT route, deleting all points except BARN and PLOT. Save the project to preserve these updated routes.
The Incident Unfolds
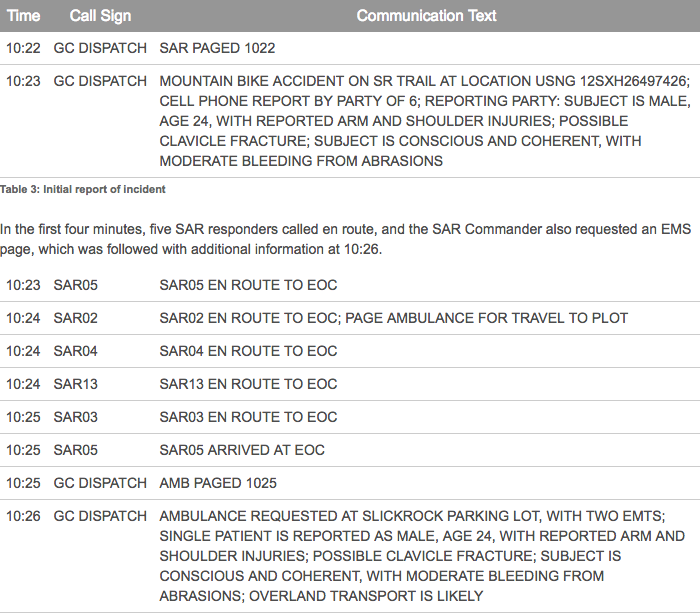
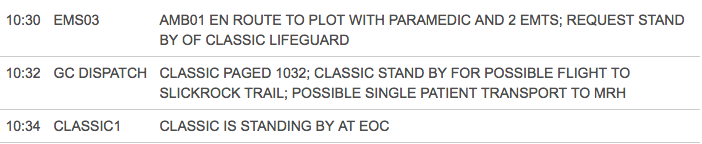
Grand County (GC) Dispatch radio communication will be used to model and map emergency response. Radio logs list time, caller, and the text of information communicated. Table 3 lists the initial communication from GC Dispatch. In this hypothetical scenario, search and rescue personnel were notified that an accident had been reported on the Slickrock Trail and a response was requested.
The incident occurred on a Thursday morning in April. Skies were clear, and the air temperature at the time of the accident was in the high 60s. In the initial communication, Dispatch automatically paged search and rescue before providing a preliminary voice description of the incident. The US National Grid coordinates were used to locate the accident and will be used to route to it. The 24-hour clock and Clear Text will also be used for communication. (Clear Text provides a common language to be used by communications centers and field units while responding to emergency incidents.)
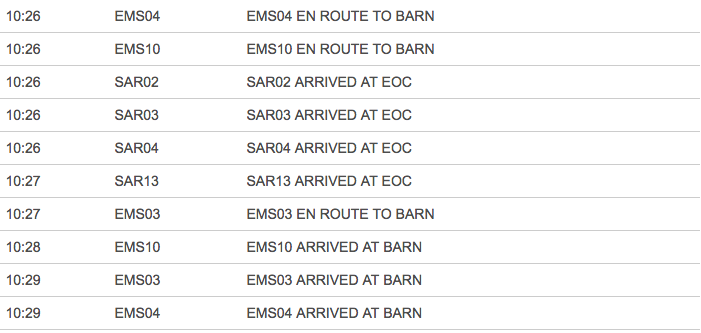
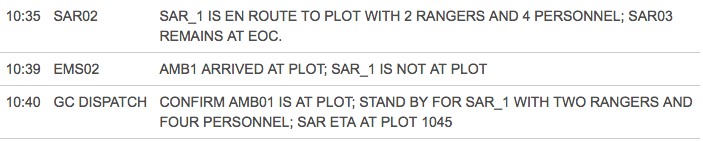
In the next four minutes, three EMS responders traveled to BARN and prepared AMB01 to respond. SAR personnel continued arriving at EOC, where they prepared for response to the PLOT. Use the resource accumulation Closest Facility analyses to verify the travel times. In the TOC, right-click Routes within the SAR Personnel Closest Facility solver and open the Routes attribute table. Stretch the table to fit and verify that records are sorted in ascending order by [FacilityRank]. Notice that Member SAR16 requires only 0.67 minutes (40 seconds) to travel to the EOC, while SAR01, the sixth responder to arrive, requires 3.18 minutes to travel to the SAR base. Use this procedure to validate response times for EMS responders. Remember that each responder will also require one to three minutes to reach his/her vehicle and begin travel.
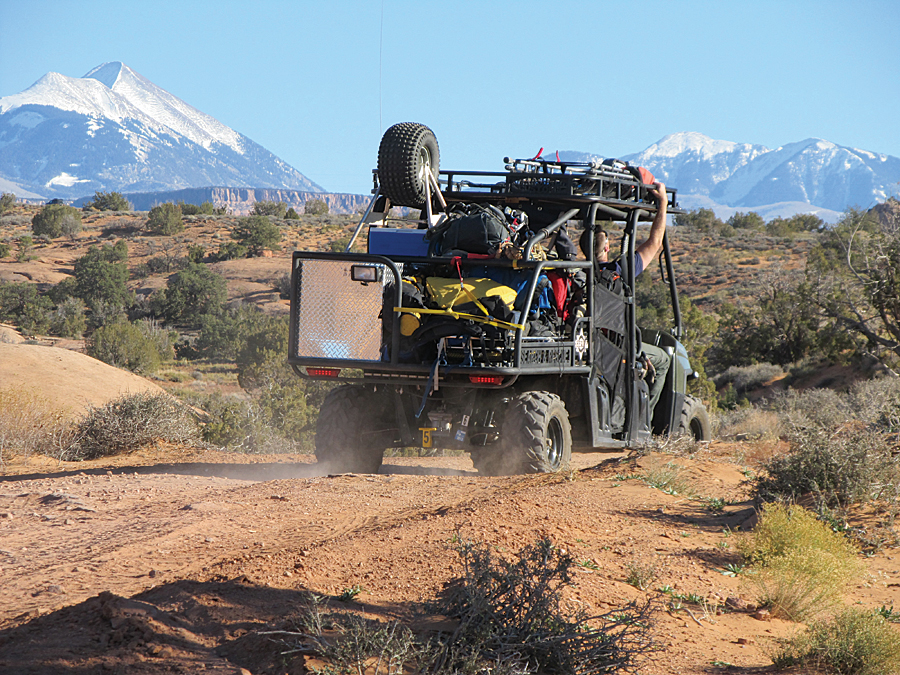
Response protocol to this type of incident specifies at least four SAR personnel, traveling with two Polaris Ranger ATVs and at least two EMTs responding with one ambulance. ATVs transport all necessary personnel to the scene.
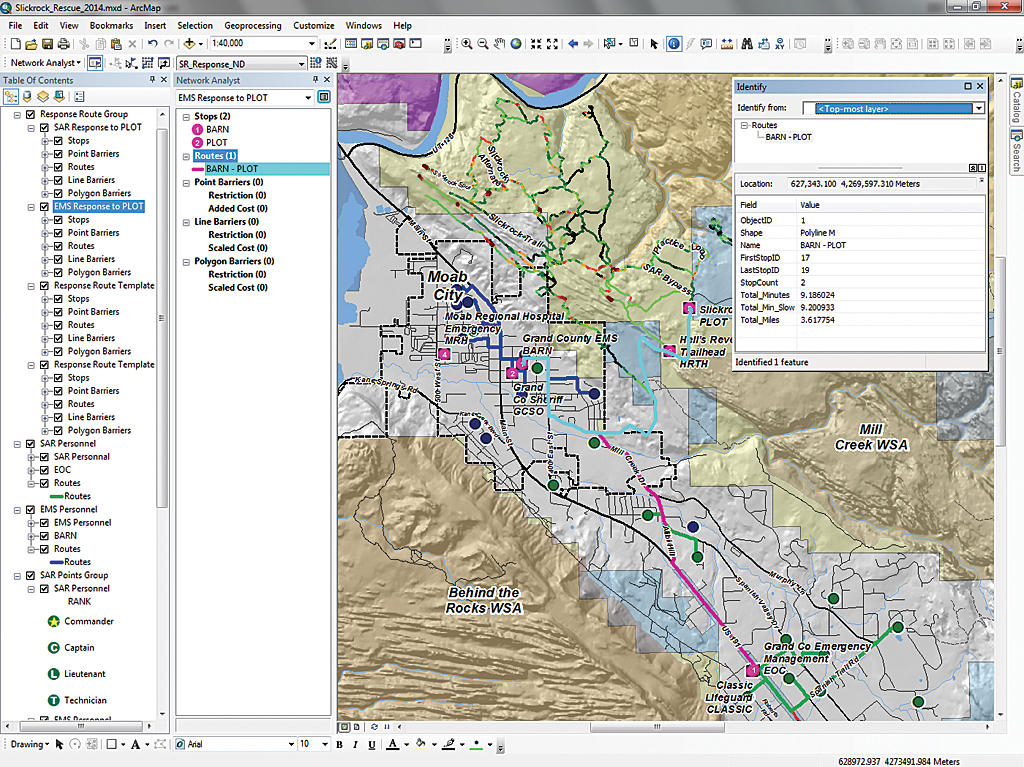
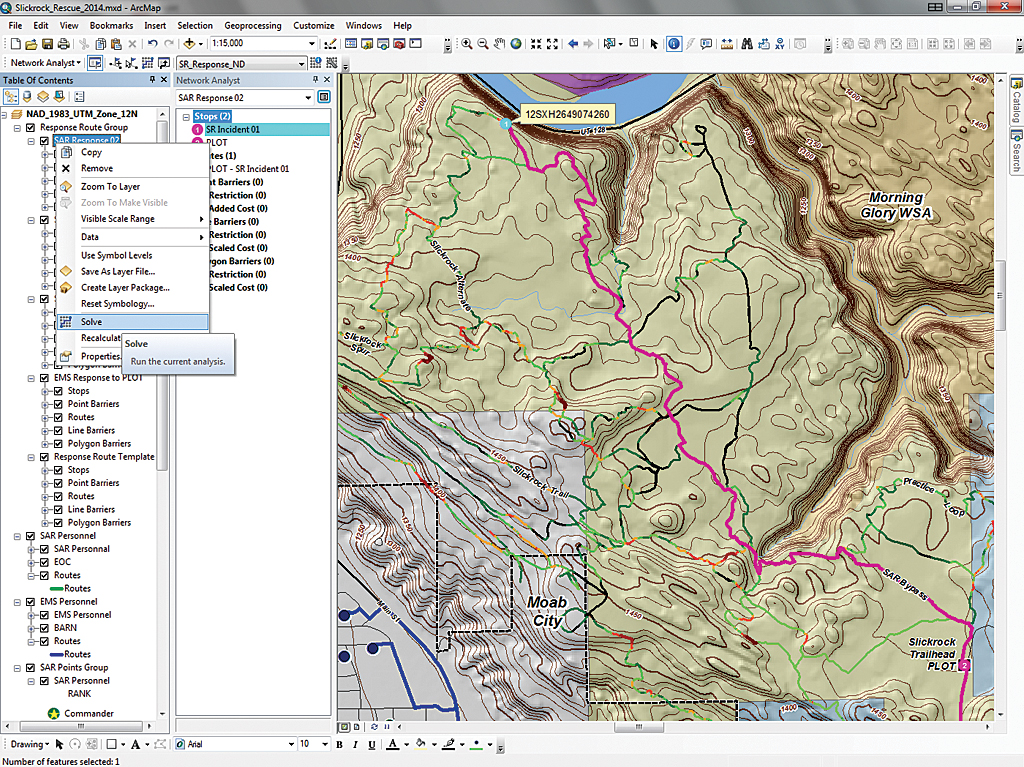
To model EMS and SAR personnel travel times from their respective bases to PLOT, right-click on SAR Response to PLOT and EMS Response to PLOT and choose Solve. After solving, check times by using the Identify tool to select the route. (Alternatively, the attribute table for each route could be opened, but it would take too much time.) Notice that Total_Minutes and Total_Min_Slow are nearly identical for highway travel. Compare the radio log response times to modeled highway response times and note they are quite close.
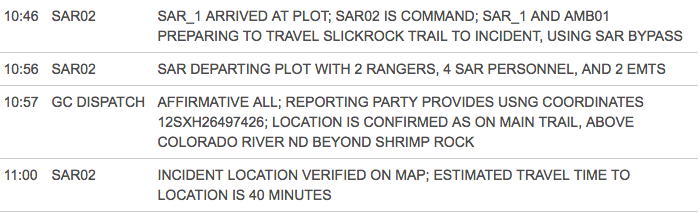
SAR_1 arrived at PLOT at 10:46 and prepared for the trip out on the Slickrock Trail, estimated to take less than 10 minutes. Because it is critical to map the incident, GIS-trained responders take control and use the template previously created.
- Zoom in to Bookmark SR Response 1:25,000.
- Right-click the next template in the stack, open its properties, and rename it SAR Response 01.
- In the Network Analyst window, select and delete all stops for SAR Response 01 except PLOT. Save again.
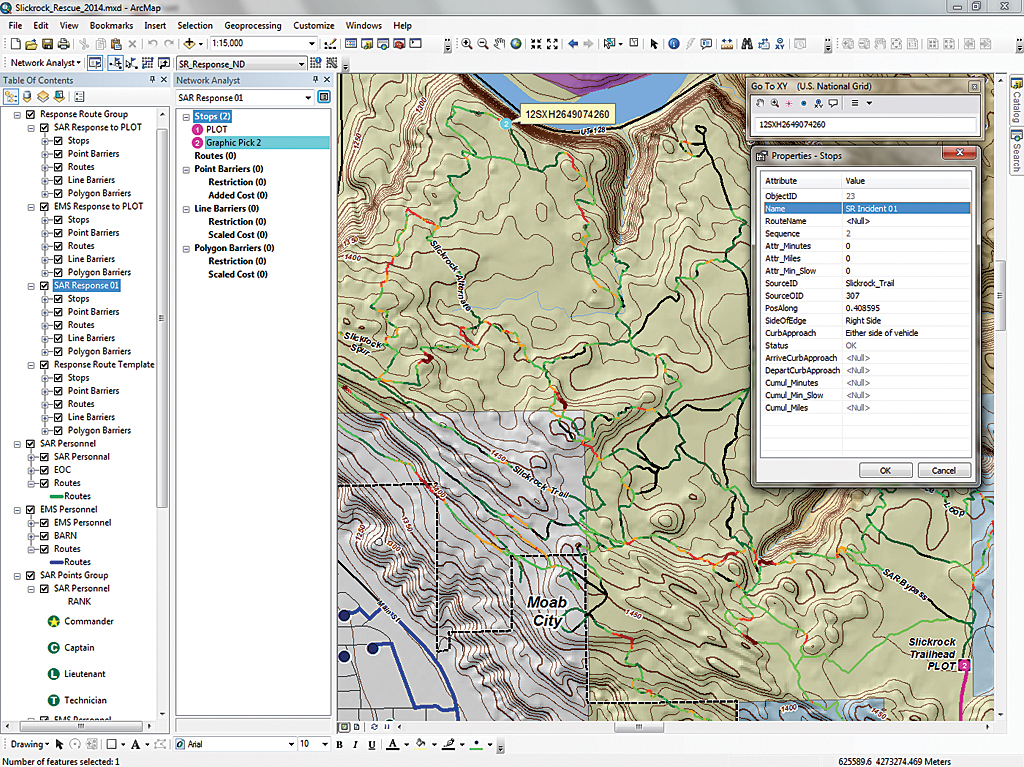
- The incident was reported at USNG coordinate 12SXH26497426. (Note the 10-meter precision in this address, which is very helpful.) To plot the incident, select the Go to XY tool on the Tools toolbar and use the tool drop-down to change coordinates to US National Grid. Type in the full coordinate and ArcGIS will change it to all uppercase.
- Use the Add Callout tool on the XY dialog to display a label for the incident location. It is far out on the trail.
Routing to the Incident
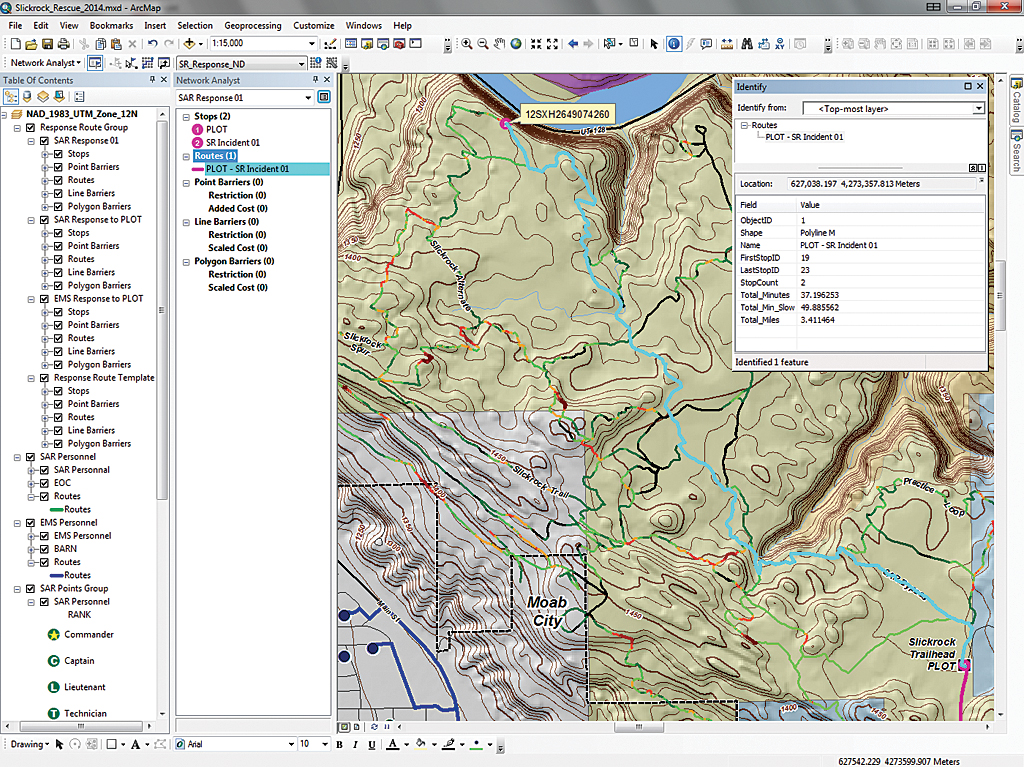
The simplest way to add the incident point to RS Response 01 route is to use the Network Analyst Create Network Location Tool located in the Network Analyst toolbar.
- Use the 1:15,000 bookmark to zoom to the incident location and use the Create Network Location tool to drop a point on the Callout arrow.
- Right-click on an incident point and open its properties. Rename it SR Incident 01. Save the project.
- In the TOC, right-click on SAR Response 01 and choose Solve. After solving, save the project again.
- Change the color of the new routes to better identify them. Use the Identify tool to compare travel times for Total_Minutes and Total_Min_Slow. It would take the two responding rangers more than 25 minutes to reach the incident. Incident Commander for SAR02 relayed this information to Dispatch and the EOC.

On Scene
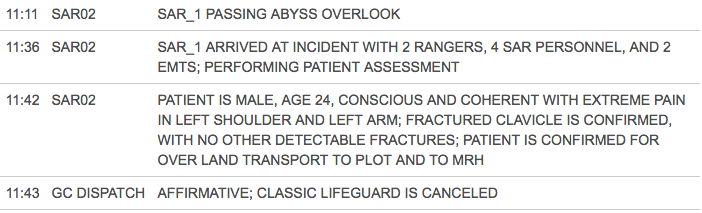
SAR_1 passed the Abyss Overlook and arrived on scene at 11:36. The patient was assessed, treated, and prepared for overland transport to PLOT. While EMTs assessed the patient, the SAR GIS technician modeled the best return route. Because the patient will be transported overland, the CLASSIC flight was canceled.
- To create a return route, copy the current SAR Response 01 route and paste the copy back into the TOC.
- Rename the copy to SAR Response 02. To reverse the travel direction, in the Network Analyst window under Stops, place SR Incident 01 above PLOT.
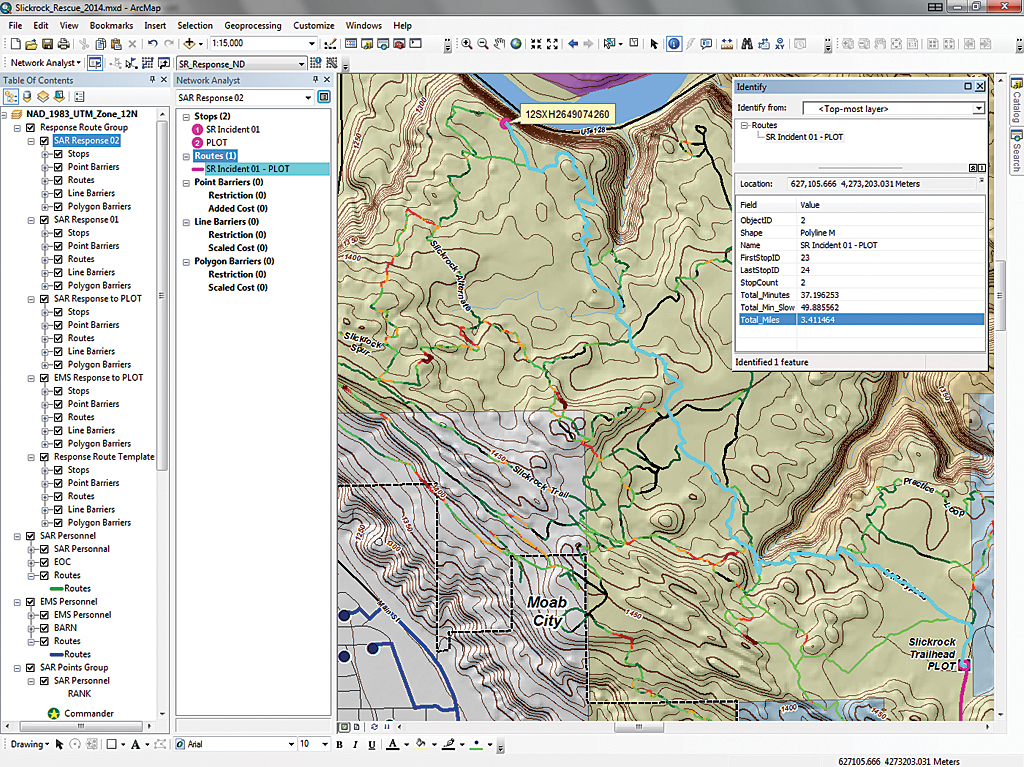
- Right-click on SAR Response 02 in the TOC and choose Solve to create the modified route. Save the project again. Use the Identify tool on the return route. Notice that the travel time (Total_Min_Slow) has increased to nearly 50 minutes.
Getting to Moab Regional Hospital
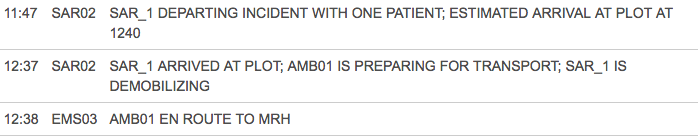
At 11:47 SAR02 called in for the return trip to PLOT. SAR_1 arrived back at PLOT with the patient at 12:37 and began demobilizing and loading the two Rangers. Available personnel quickly transferred the patient to AMB01 and prepared for travel to Moab Regional Hosptial (MRH).
- To calculate travel for AMB01 to MRH, zoom back to SR Incident 1:25,000. Make another copy of Response Route Template and paste it back into the TOC.
- Rename the copied route EMS Transport from PLOT to MRH. In the Network Analyst window, delete all stops except PLOT and MRH.
- Right-click on the EMS Transport from PLOT to MRH layer in the TOC and choose Solve. Using the Identify tool, verify that the trip back to MRH, traveling through southern Moab, should require less than 12 minutes.
The Story Continues
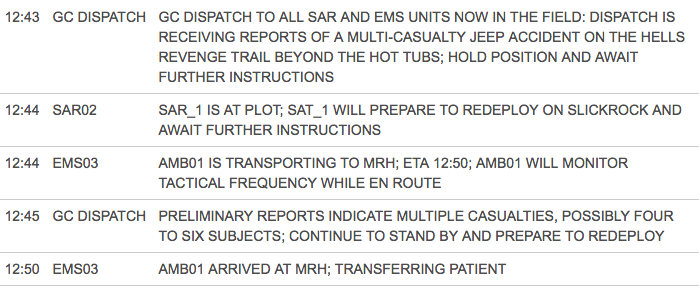
After AMB01’s departure for MRH, SAR_1 continued to demobilize at PLOT until, at 12:43, an urgent message to all field personnel was relayed from GC Dispatch. A serious accident involving at least one Jeep and multiple casualties was coming in from Hot Tubs, a treacherous part of the Hell’s Revenge Jeep Trail. Early information was sketchy, and GC Dispatch advised all personnel to stand by and prepare to redeploy if necessary.
At 12:50, AMB01 arrived at MRH and transferred the patient to staff. Unfortunately, these responders were offline and not immediately available to respond to the new incident.
Summary and Acknowledgments
Again, the author thanks the agencies in Grand County that have supported the development of this response scenario and training set: the Sheriff’s Office (including the Search and Rescue and Grand County Dispatch), Emergency Management, Emergency Medical Services, the Sand Flats Recreation Area team, and the Road Department. Their assistance contributed significantly to the overall quality and reliability of the network. The response protocol presented in this exercise was derived from actual search and rescue incident and dispatch logs.