GIS can help local governments deal effectively with budget constraints while delivering the best possible service to citizens by helping officials make fact-based decisions. In this example, a public health department has eight permanent clinics. Last year, the department deployed eight mobile clinics to better serve county residents. The location of mobile clinics in the previous year were based on a best guess.
The budget this year has been reduced. There is only enough funding for four mobile clinics to augment the permanant ones. Consequently, the department needs to maximize the coverage of each clinic.
Location-allocation analysis, a tool in the ArcGIS Network Analyst extension, determines an optimal location for one or more facilities that will service demand from the surrounding population. Retail businesses use location-allocation to determine where to open a new store. Government agencies can use location-allocation to site libraries or fire stations or—in this example—mobile health clinics for providing flu immunizations. ArcGIS for Desktop and Network Analyst will help the county make more informed decisions on mobile clinic locations.
Getting Started
Download the sample dataset [ZIP] and open on a local machine.
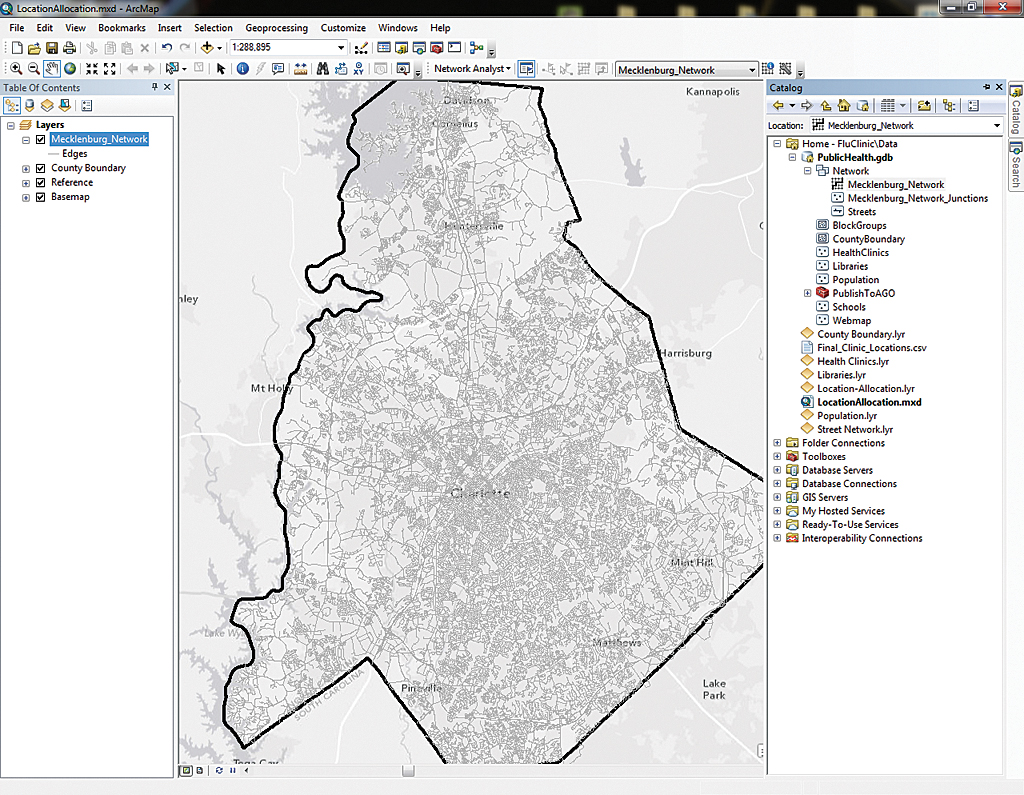
- Start ArcMap, navigate to the location of the sample dataset, and open LocationAllocation.mxd, located inside the FluClinic folder.
- Choose Customize > Extensions and make sure the Network Analyst extension is available and its toolbar is active.
- Under File > Map Properties, set PublicHealth.gdb as the default geodatabase, verify that relative paths is checked, make a thumbnail, and click Apply and OK.
- Save the map document.
Data for This Problem
The sample dataset contains all the required data. This analysis will require data on the locations of the permanent clinics, on the county’s population, and the county’s street network. Because mobile clinics were previously set up in libraries, using libraries as sites makes sense because people are familiar with them as mobile clinic locations and can easily find them. Consequently, location data for libraries is also needed. For this example, to simulate patient locations, US Census block group centroids were used.
To perform location-allocation analysis in Network Analyst requires a network dataset. This is basically a street centerline file that has attributes, such as speed limits or travel times, assigned to each road segment. A network dataset can be built using Network Analyst. In this case, the network dataset that is included with Data and Maps for ArcGIS has been included in the sample dataset and will be used.
- In the Catalog window, drag Street Network.lyr from the FluClinic folder and drop it on the map. If necessary, relink it to its data source, Mecklenburg_Network in the network dataset in the PublicHealth.gdb.
- Once added to the map, turn off Street Network.lyr in the table of contents (TOC).
- Now that a network dataset has been added to the map, the Network Analyst tools are enabled and the Location-Allocation layer can be created. On the Network Analyst toolbar, click Network Analyst > New Location-Allocation.
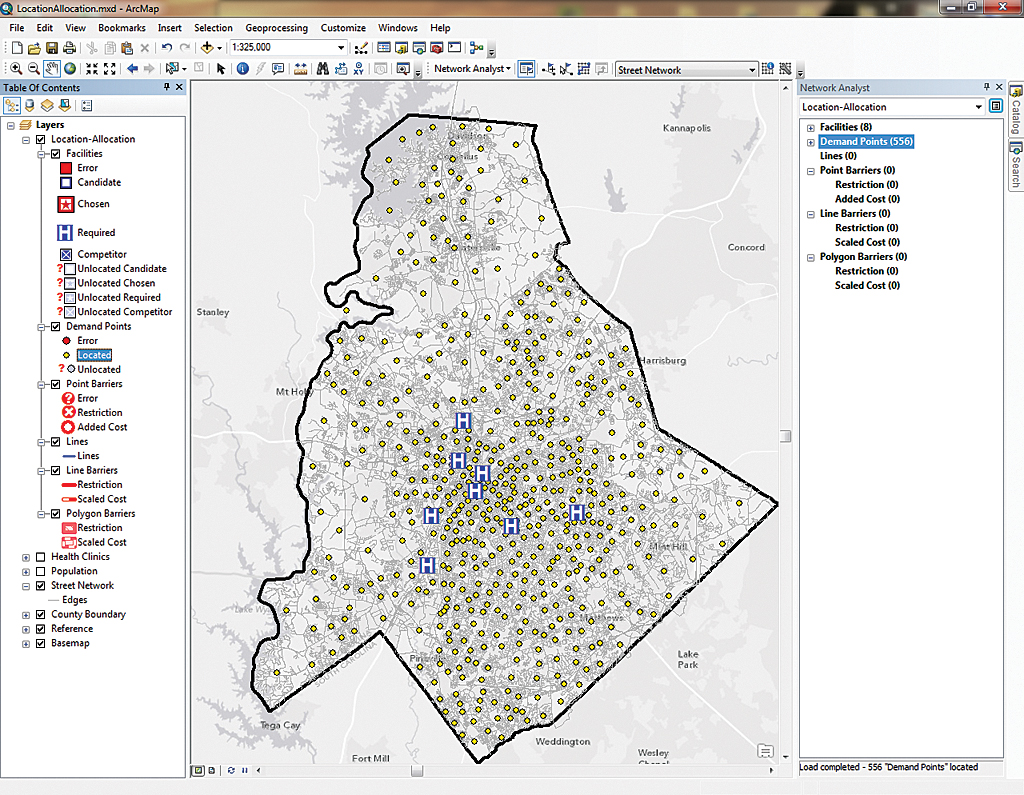
- The Location-Allocation layer should appear in the TOC. The Facilities (Health Clinics) and Demand Points (Population) can now be loaded into the Network Analyst window. Save the map document.
Loading Clinics and Population Data
By default, the Network Analyst window should have opened when the map document was opened. If it is not open, open it by clicking the Network Analyst window button on the Network Analyst toolbar.
- Use the Add Data button to add the Health Clinics and the Population layers to the TOC. Turn them off and drag them below the Location-Allocation layer.
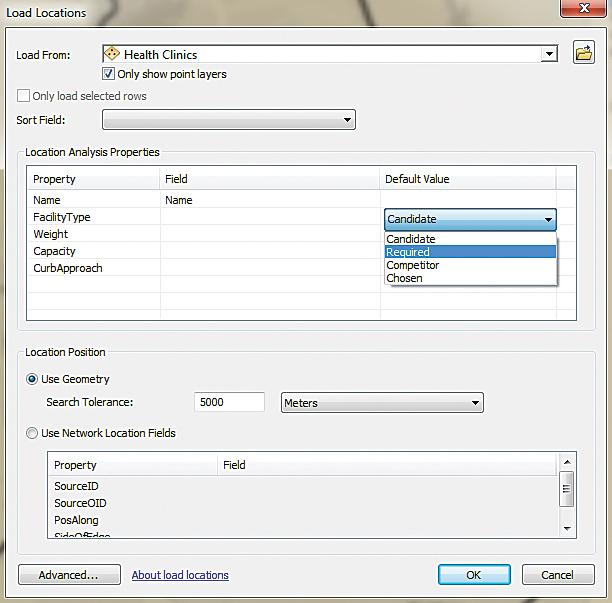
- In the Network Analyst window, right-click Facilities and choose Load Locations. Select Health Clinics.lyr from the drop-down next to Load. Accept the defaults for all properties except Facility Type. Set Facility Type as Required. These clinics are permanent, so the tool should always use them. Once added to the Facilities layer, these points are automatically added to the map.
- In the Network Analyst window, right-click Demand Points, select Population as the layer to load from, and accept all defaults. Wait while the Demand Points layer populates with simulated patient data.
- Save the map document.
Identifying the Problem
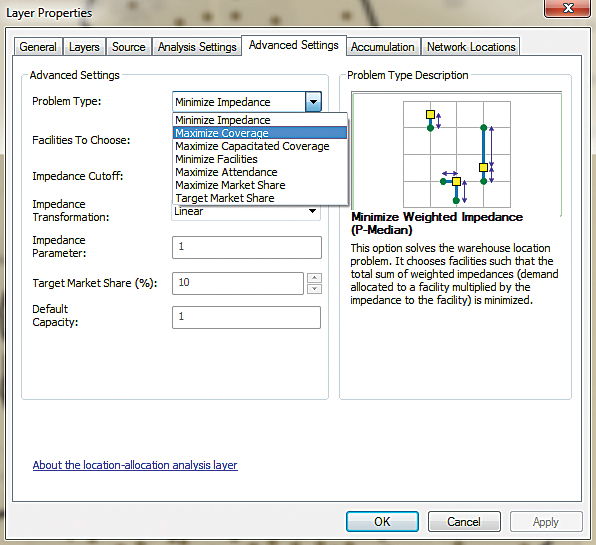
Think about which problem should be solved by this analysis. Is the goal to minimize impedance? Not really. Impedance is an aspect of the solution but does not address the real problem. Is the goal to minimize the total number of facilities for the demand? No, actually it is the opposite. The goal is to select clinic locations within a reasonable distance from most residents. Consequently, Maximize Coverage is the correct analysis choice. It will generate a solution that identifies optimal locations for a finite number of clinics that would serve as many residents as possible.
Looking at the Existing Situation
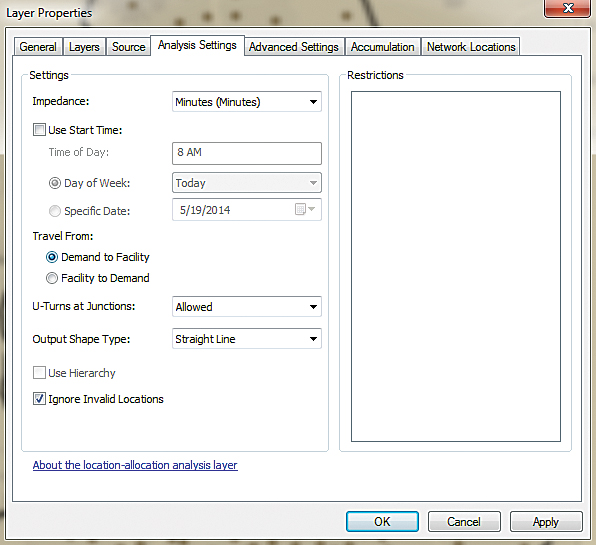
- Right-click the Location-Allocation layer in the TOC and choose Properties. Click the Analysis Settings tab. Verify that Minutes is selected for Impedance. Click the radio button to set the direction of travel to Demand to Facility to simulate patients traveling to clinics.
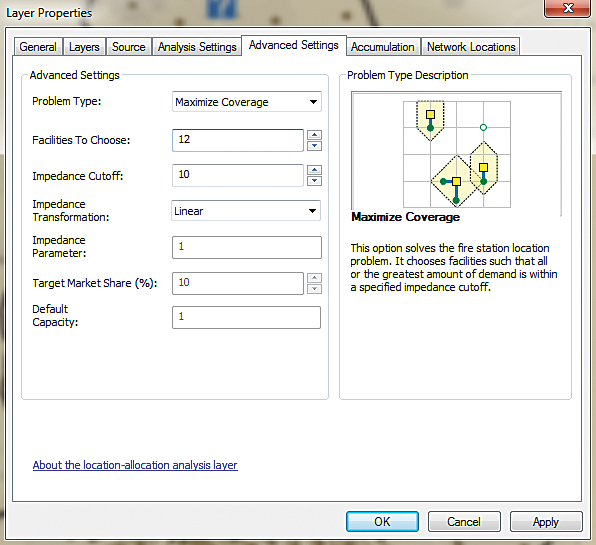
- Click the Advanced Settings tab. Set Problem Type to Maximize Coverage. Under Facilities To Choose:, specify 8 for the eight permanent clinics. Set Impedance Cutoff to 10 to indicate that 10 minutes is the maximum time a patient would be willing to spend traveling to a clinic.
- Click Apply, then OK.
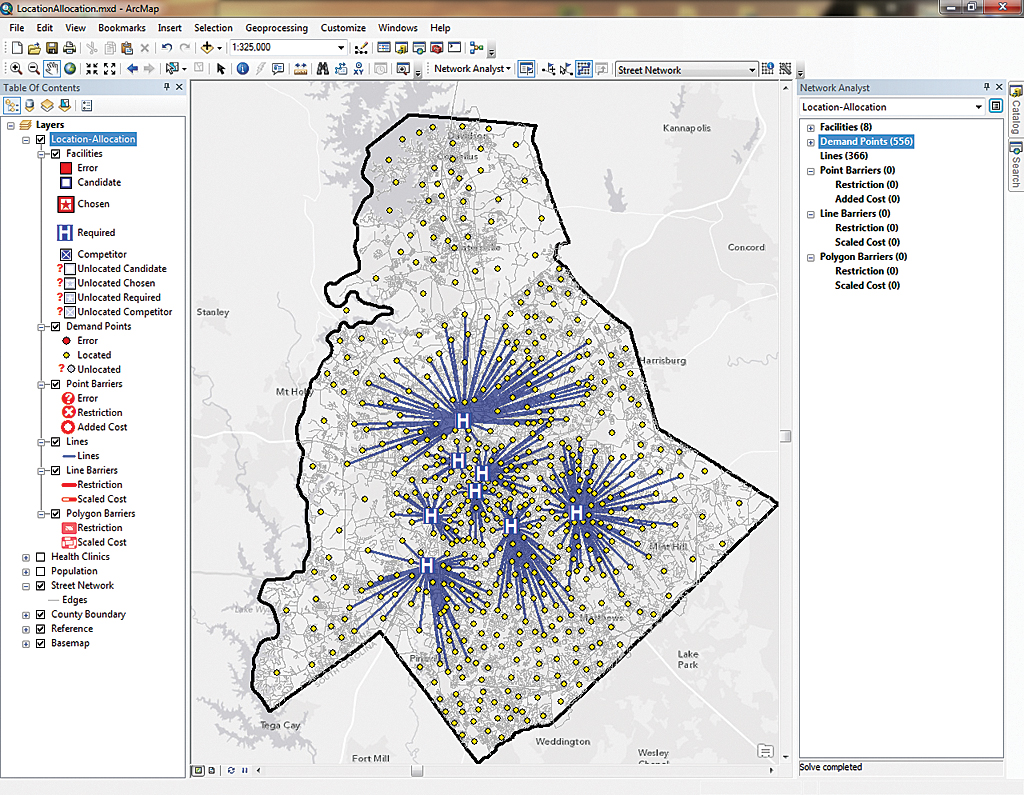
- With all the options set, the analysis can be run. Click the Solve button on the Network Analyst toolbar. When the analysis is complete, it should show that 366 of 556 residents are within a 10-minute drive of a permanent clinic. This is about 60 percent of the population. More clinics will be needed to provide acceptable service to residents.
Adding Mobile Clinics
The budget will fund four additional mobile clinics so more patients can be served. The challenge is identifying areas that are not being served and locating mobile facilities that will improve service to those areas. The experience of previous years indicates that libraries work well as mobile clinic locations because residents can easily locate them, and they have been used as mobile clinic sites before. Although there are a lot of libraries, there is only funding for four clinics, so the solver will be used to find out which libraries will best serve the demand.
- To determine which libraries will make the best mobile clinic locations, drag the Libraries.lyr file from the Catalog window to the TOC. Turn this layer off.
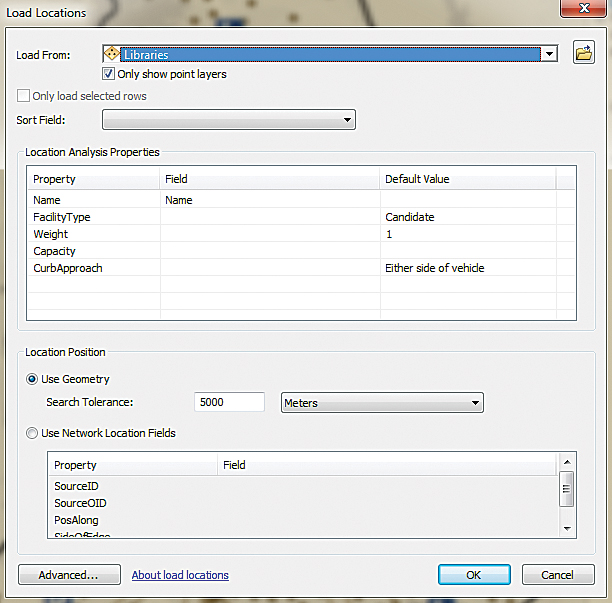
- Right-click Facilities in the Network Analyst window and choose Load Locations. Choose Libraries.lyr and accept all defaults. Unlike the Health Clinics.lyr, which contained the permanent clinics, the Libraries will be used to generate candidate sites, so do not change Type from its default of Candidate.
- After loading the Libraries.lyr, right-click the Location-Allocation layer in the TOC and choose Properties. Click the Advanced Settings tab again and change Facilities To Choose: to 12. That will be the total number of facilities—the eight permanent clinics that will be automatically included because they are required and the four best library locations for a total of 12 locations. Click Apply then OK.
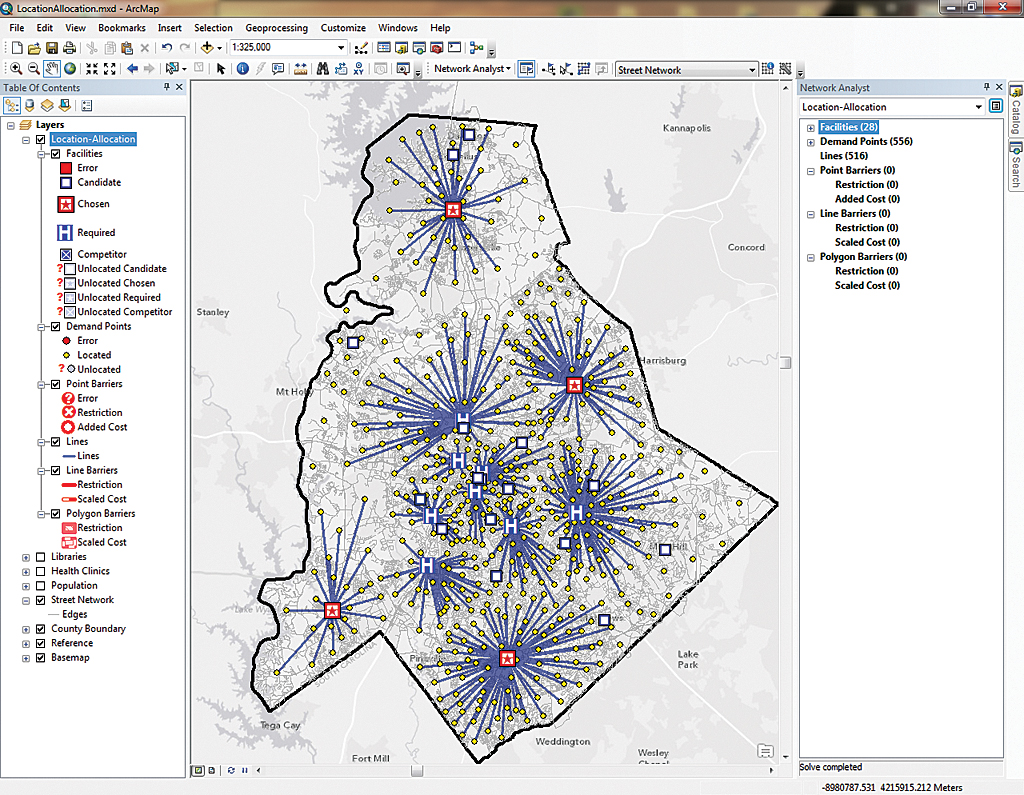
- Click the Solve tool again. The results of the analysis will show the optimal choices for four libraries to host mobile health clinics, indicated by green check marks, as well as the permanent clinics shown with hospital symbols. Non-optimal library locations will be shown as blue question marks.
- In the Network Analyst window, look at Lines to see that 516 of 556 residents are within 10 minutes of a clinic. That’s 92.8 percent of residents, which is a substantial improvement.
Communicating Results
The locations of these mobile clinics can be communicated to the public by embedding a web map in the county health department’s website. The results of the analysis can be published directly from ArcMap in ArcGIS for Desktop as a service hosted on ArcGIS Online, then shared as a web map.
Once the service has been created on ArcGIS Online, open it in the ArcGIS.com map viewer. Make any adjustments desired to the map. Click the Share button from the ArcGIS Online interface. Click the EMBED IN WEBSITE button. The HTML code needed to embed the map in a website is automatically generated. Simply copy and paste it into the desired web page. It will look just like the web map you made with the results on ArcGIS Online.
Summary
Using GIS to optimally locate the additional clinics is far superior to “just eyeballing.” This analysis uses the actual street network and an analysis of the demand that factors in maximum travel time for patients. By using ArcGIS for Desktop with the Network Analyst extension and some simple datasets for clinic locations, population, library locations, and a network dataset that included travel time, it took little time to identify which libraries were the best sites for mobile clinics and ensure good service to residents while staying within the budget by adding only four clinic locations.
Acknowledgments
This article was based on a demonstration created by Harry Moore and Tim Craig of Esri’s California regional office for the Sharpening Your Skills seminar series. Data for this exercise was supplied by Esri, the City of Naperville, Illinois, and the Minnesota Department of Natural Resources. View a video of this demonstration and others in the Sharpening Your Skills series at esri.videos.com.
About the authors