A nonprofit organization dedicated to preserving water quality and a viable rural economy in upstate New York used imagery and GIS to better safeguard the New York City Watershed.
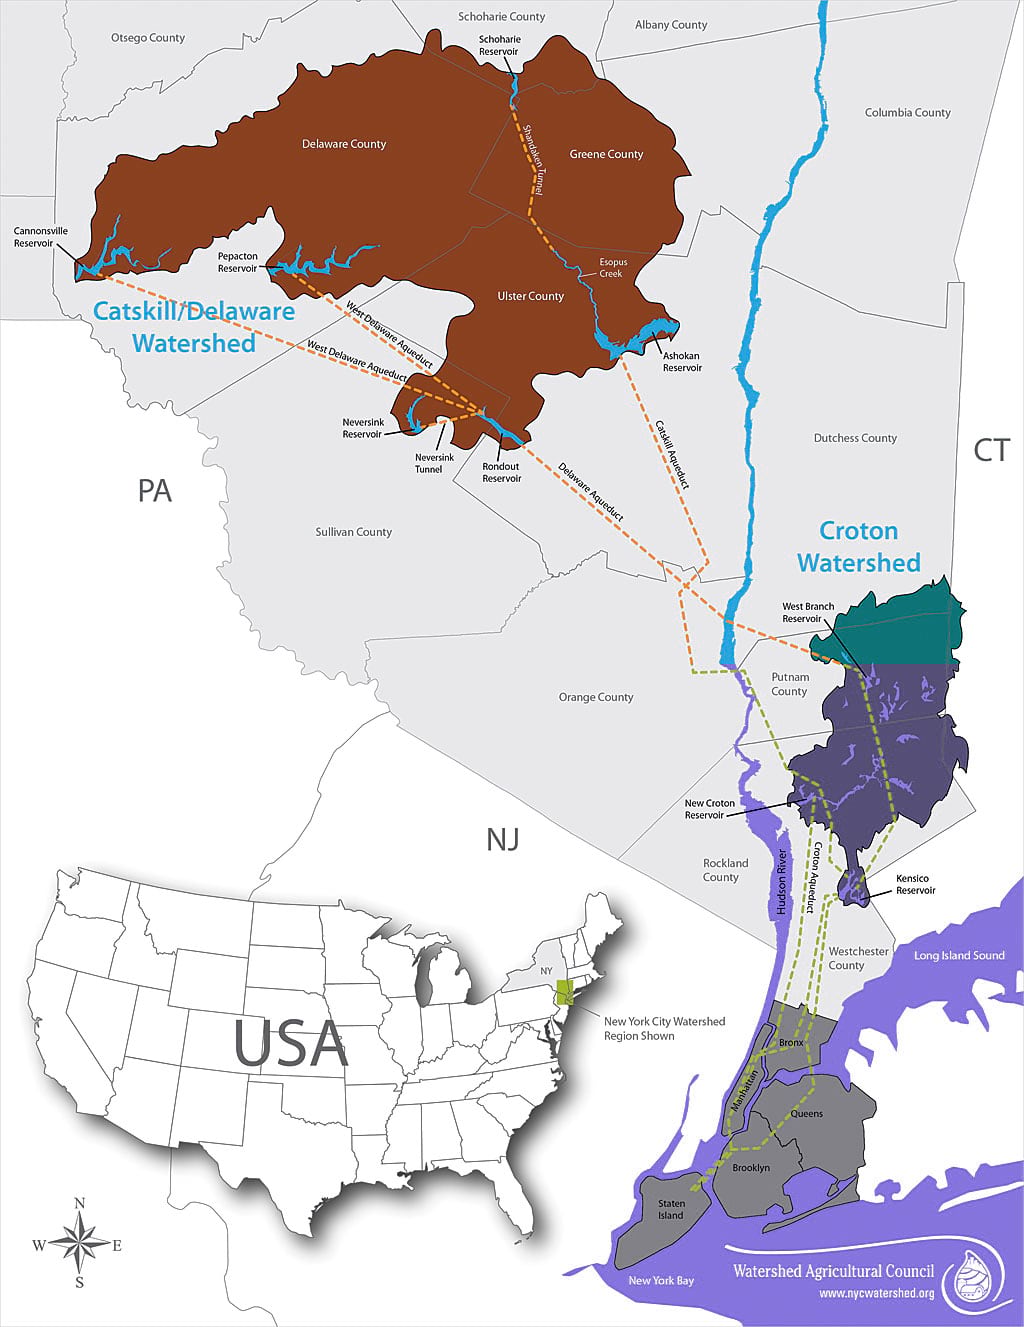
The New York City Watershed is the largest unfiltered surface water supply system in the United States. Every day this region in upstate New York’s Catskill Mountains provides more than a billion gallons of clean drinking water to the more than 9 million people residing in New York City and upstate counties. The system includes 19 reservoirs, three controlled lakes, and a watershed that spans more than a million acres. In some cases, water travels more than a hundred miles to reach New York City.
Other large US cities typically own the land that drains into their reservoirs. New York City is unique. Private citizens control about 75 percent of the water supply region. Consequently, New York’s water quality depends in large part on the actions of the 30,000 landowners who live, work, and recreate on watershed lands.
The Watershed Agricultural Council (WAC) is a nonprofit organization based in the New York City Watershed. WAC seeks to balance water quality protection with a viable rural economy. To accomplish this, the organization uses technical assistance and cost-sharing to help watershed farmers and loggers use water quality protection measures (known as best management practices, or BMPs) in their farm operations and timber harvests. Since WAC’s founding in 1993, the organization has helped 90 percent of the watershed’s farms improve the effect of their operations on water quality.
Until recently, WAC had no way to gauge its effectiveness in improving the effect of logging operations on water quality. Farms are static, but logging operations move across the landscape. Unlike some other US states, New York has no system of timber harvest notification requiring landowners or loggers to alert the state before logging. This meant WAC had no way of knowing how much logging was taking place in the New York City Watershed, the extent that logging activities threatened water quality, or how effective WAC’s programs were in reducing water pollution from logging.
That changed in 2016. WAC learned about Feature Analyst, an extension for ArcGIS developed by Esri partner Textron Systems. Feature Analyst can interpret aerial photographs and translate the features in them to create ArcGIS layers suitable for geoprocessing. WAC set out to use ArcGIS and Feature Analyst to identify all logging in the New York City Watershed.
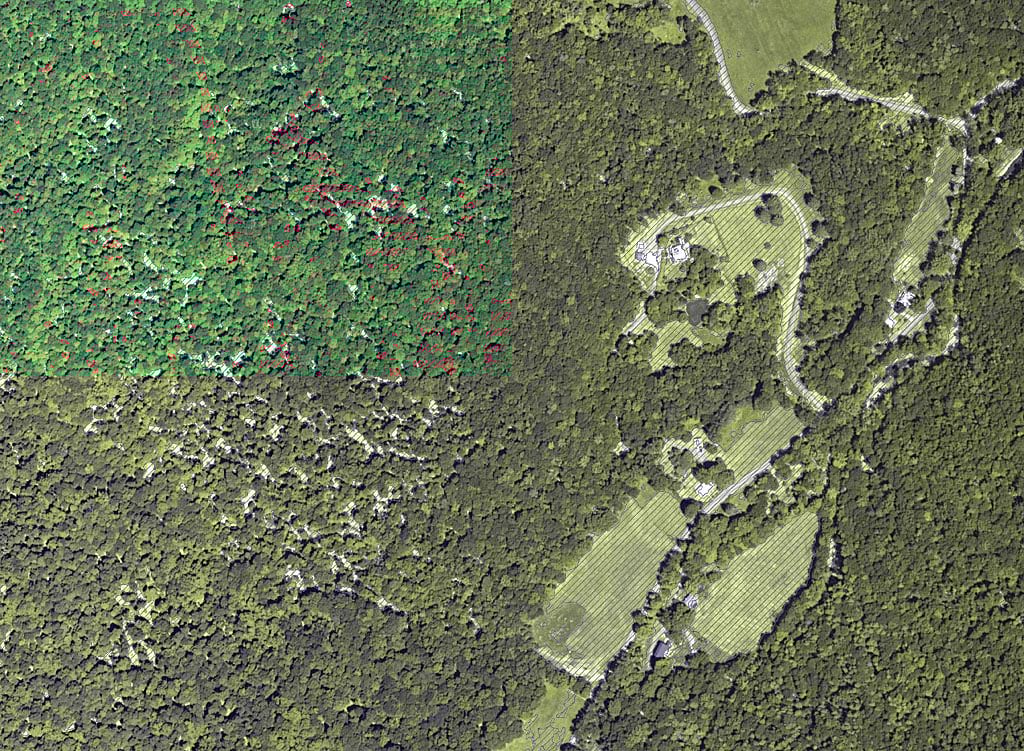
In the first step in this process, a GIS analyst added aerial photos of the watershed to ArcGIS. WAC used National Agriculture Imagery Program (NAIP) photos taken in 2013 and 2015 because they were the most recent “leaf-on” (i.e., taken during the growing season) images available. Leaf-on imagery was essential to spot canopy gaps that would signify where logging had occurred. The GIS analyst used original TIFF photos rather than compressed county mosaics because creating mosaics alters the value of individual pixels. Most of the NAIP images for the New York City Watershed were taken in July 2013 and July 2015, so those months became the start and end dates for logging site identification.
The next step was manually indicating examples of what WAC wanted Feature Analyst to find in the images—to create training sets for the software. WAC records where BMP cost-share programs work with loggers, so those were the initial locations for training sets. Those training sets marked canopy gaps, usually spots of brown, bare ground surrounded by green tree canopy. Feature Analyst uses the reflectance values and textures of the features inside and bordering the training set to identify similar features elsewhere in an aerial photo. The initial output is often poor and contains many irrelevant features such as roads, fields, and buildings.
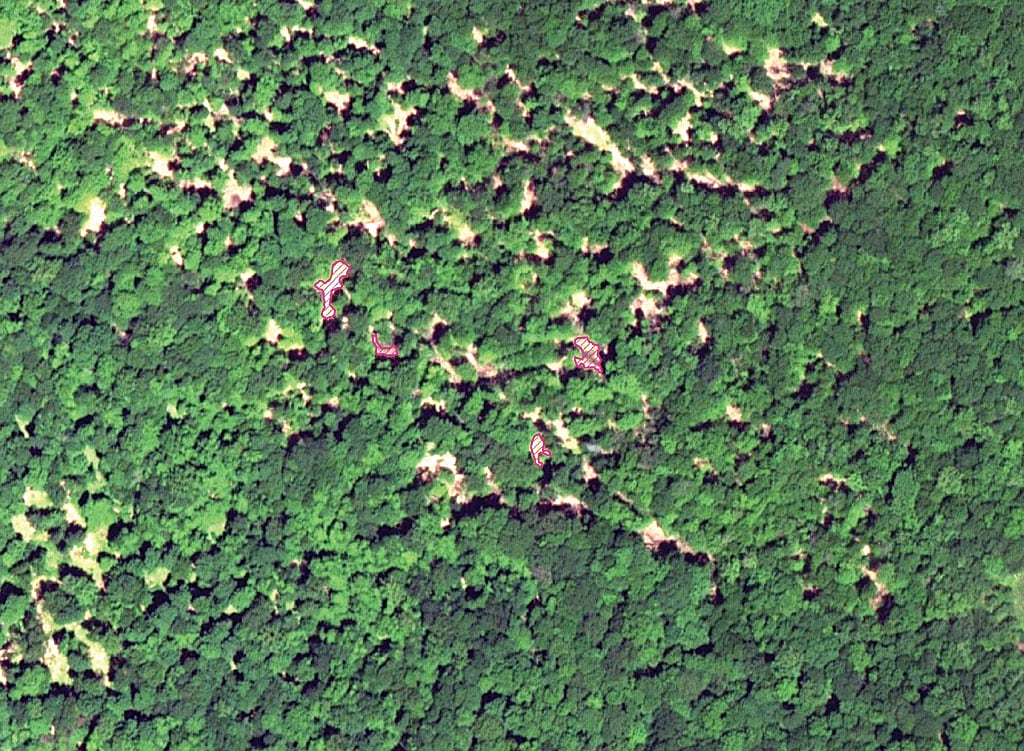
To improve these initial results, Feature Analyst allows the user to indicate sample areas that the software got right or wrong. Feature Analyst then uses this information to learn what the user is looking for. After several rounds of this learning process, the software became better at identifying canopy gaps. Once Feature Analyst could reliably identify canopy gaps, the software’s batch processing function allowed analysis of multiple aerial photos automatically. WAC identified properties where logging occurred by overlaying Feature Analyst’s results with county tax parcel layers. The organization only works on private lands, so they excluded tax parcels owned by government agencies.
Feature Analyst isn’t perfect. Even after multiple rounds of training, it would pick up features that looked like logging sites but were blowdowns and trees killed by insect infestations. To correct these issues, the GIS analyst manually double-checked the results and removed tax parcels where Feature Analyst had erroneously selected features. The GIS analyst intentionally trained the software to be aggressive in identifying canopy gaps, because it was easy to remove incorrect parcels, while there was no practical way to find logging sites Feature Analyst missed.
When Feature Analyst located a logging site, the analyst confirmed whether it happened during the project window by comparing the 2015 photo against the 2013 one. If it did, the analyst recorded the harvest boundary based on the canopy gaps Feature Analyst identified. The analyst also classified the logging in one of four categories—Light, Heavy, Clearcut, or Land Clearing—based on how much canopy was removed.
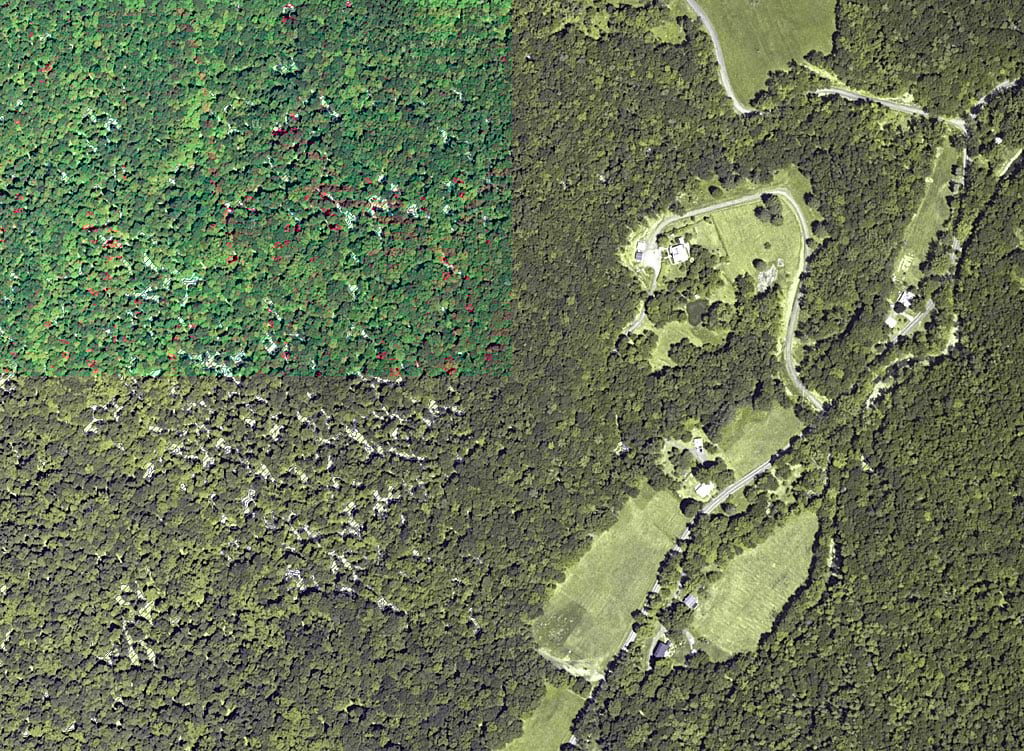
Light areas had less than 50 percent of the canopy removed, while areas classified as Heavy had more than 50 percent of the canopy removed. Clearcut areas had 100 percent of the canopy removed. Land Clearing areas were places where the land use changed to nonforest use.
Harvests classified as Land Clearing were recorded but excluded from the final tally because they represented land-use change. WAC wanted to know where logging occurred on land that would either remain as is or return to forest cover after the harvest.
In practice, separating Land Clearing areas from Clearcut areas was straightforward owing to factors such as the size of the cut, its location relative to roads, the size of the parcel, the addition of any structures, and whether other logging occurred in the same parcel.
Finally, the analyst identified all the areas where logging occurred within 100 feet of a stream by intersecting the final logging layer with a 100-foot buffer of New York City Watershed streams. The National Hydrography Dataset (NHD) provided the stream layer to produce this buffer. The NHD was chosen for its accuracy and inclusion of smaller streams compared with similar layers.
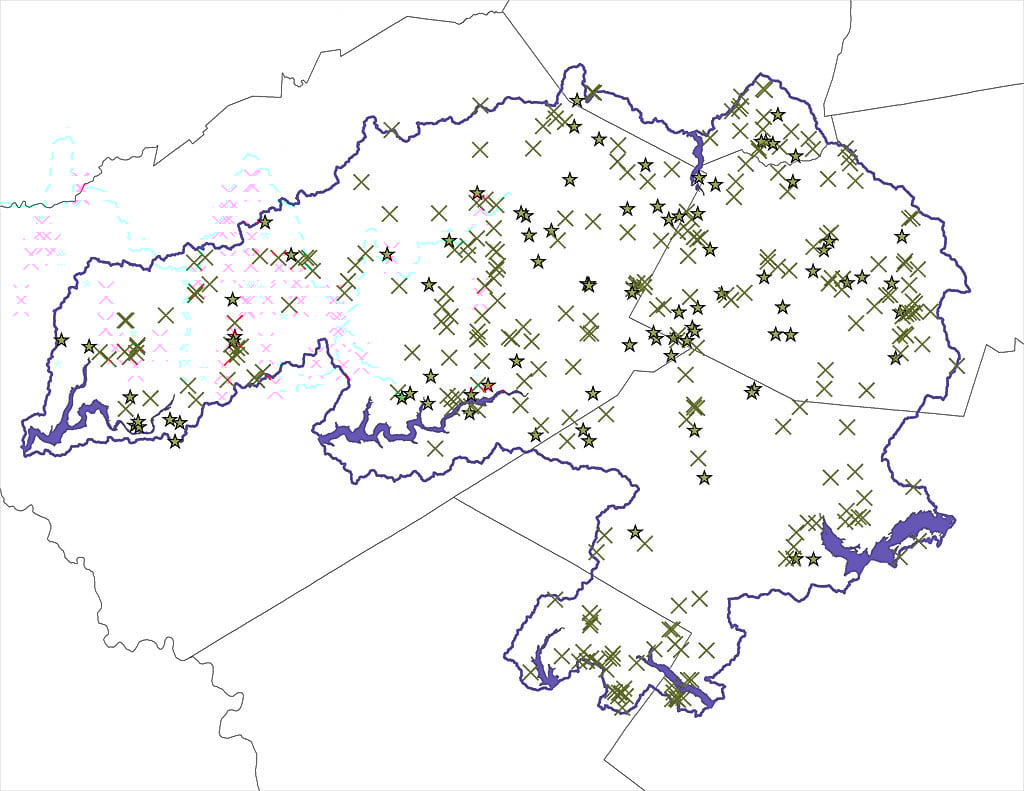
The entire project took one GIS analyst about three months to complete. WAC plans future replications of the project as new NAIP imagery becomes available. This project revealed—for the first time ever—the scope of logging in the New York City Watershed. WAC learned that the watershed has 183 timber harvests on private lands annually, covering an area of 7,092 acres. This area represents 1.25 percent of the watershed’s private forest cover, a level of harvesting that should allow for a sustained yield of timber over time. WAC’s logging BMP cost-share program works on 45 of these harvests annually, but these are primarily the larger harvests, so 40 percent of the harvested acres occurred on logging jobs where WAC funded BMPs.
The project also revealed areas of the watershed where WAC has little presence, which will help the organization market its programs. WAC will be able to selectively reach out to loggers and landowners in these regions to encourage them to work with the organization when they log their properties.
WAC also learned that the cutting of trees is not specifically a threat to New York’s water supply. Nearly all acres logged were Light harvests (93 percent), meaning loggers removed less than 50 percent of the canopy. Almost no logging (5 percent of harvested acres) occurred within 100 feet of a stream, and 96 percent of that logging was Light.
This is good news for water quality, because previous research in the watershed had found that when canopy removal is less than 50 percent, increases in common water pollutants like nitrates are minimal and short term. Only when intensity increases beyond 50 percent do those increases become significant and long lasting. That said, the systems of roads and trails loggers use to remove timber from the woods can still cause water quality problems even for Light harvest areas, so WAC plans to expand its efforts to help loggers adopt more BMPs on those trails.
Thanks to ArcGIS and Feature Analyst, WAC learned the extent of logging and its water quality impacts in the New York City Watershed. The organization also gained insight into the reach of its cost-share programs and identified places to target its outreach. With this technique, WAC finally has a way to track its progress and ensure the logging industry does its part to protect the water 9 million New Yorkers depend on.
For more information, contact Josh VanBrakle, GIS specialist at the Pennsylvania Land Trust Association, at joshvanbrakle@gmail.com.