April - June 2006
April - June 2006 |
||||||||
|
|
||||||||
Pierce County GIS has multiple sets of imagery that span several years. County employees from many departments use these datasets to view how the landscape has changed over time. Methods for viewing the same geographic extent with multiple image layers were slow and cumbersome. Based on user demand, Pierce County GIS undertook a project that would allow county employees to easily view multiple images of the same area from several different years. The Ortho Viewer Web application helps casual GIS users view the history in geographic data. The project included several challenges from user interface design and system architecture to application programming. The application developed by Pierce County GIS uses ArcIMS, ArcSDE, Microsoft SQL Server, and ColdFusion MX to cleverly make viewing history in geography easy. Understanding the ProblemPierce County GIS has more than 700 geographic datasets. Among the most useful are the image layers. Currently, Pierce County has 10 image layers that span five years from 1998 to 2003 and include orthophotography and color infrared imagery. Each layer was flown during different seasons, with various focal lengths and flight heights. The resulting images have a range of pixel sizes and positional accuracy. The orthophotography layers use several terrain models including Lidar and 30-meter United States Geological Survey (USGS) digital elevation models (DEMs). The image layers are wildly popular among county GIS users because they add detailed contextual information to maps. Pierce County's CountyView enterprise GIS system, based on ArcView 3.x, lets county GIS users view multiple images from different years using the flip book approach. Users add two or more image layers to the view, turn them on and off to view the change. The other method currently involves opening multiple views and adding one image layer to each view, then manually tiling the views to make each one visible. The first option suffers from slow redrawing time. The second option is really only viable for someone who is both patient and knowledgeable. Designing the User InterfaceHow do you view history in geographic datasets? Initial work focused on designing a user interface that would make viewing multiple sets of imagery simple and intuitive. To allow for easy deployment and rapid development, Pierce County GIS decided to build the Ortho Viewer as an intranet Web application.
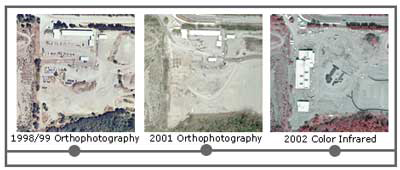
The first design element in this project utilized was Tufte's small multiples. According to Edward Tufte in The Visual Display of Quantitative Information, "Small multiples are economical: once viewers understand the design of one slice, they have immediate access to the data in all the other slices." [Tufte is a professor emeritus at Yale University and author and publisher of books on information design.] The Ortho Viewer uses small multiples to represent sets of imagery from different years side by side. Viewing maps in this form allows for easy comparison. The second design element was a timeline that would stress the importance of time. The images being compared would be ordered by date to emphasize this temporal aspect. The earliest image layer is always first and ends with the most recent image. The third design element focused on a set of intuitive controls that let people efficiently find a location of interest. Initial designs provided address, parcel, and place-name searches. The fourth design element called for filtering image layers by geography. If an image layer doesn't exist at the user's current geographic extent, it should not be selectable. This makes it easy for users to decide which layers to turn on because they are always dealing with a subset of the total number. Continued on page 2 |