Summer 2009
Summer 2009 |
||||||||
|
|
||||||||
GIS can provide a tremendously effective framework not only for monitoring and disseminating information about these expenditures but also as a decision-making tool for prioritizing and optimizing the execution of projects and programs. Work to Be DoneEconomic stimulus is an aspect of an economic theory, known as fiscal policy, developed by John Maynard Keynes in the 1930s. Fiscal policy advocates the use of government spending and revenue collection to influence the state of a nation's economy. In the absence of spending by individuals and businesses, this theory posits that the government can increase aggregate demand for goods and services by making up the shortfall in private-sector spending through supplying stimulus funding. The American Recovery and Reinvestment Act of 2009 (ARRA) was based largely on proposals made by President Obama to fulfill promises he made during the presidential election. The wide-ranging provisions of ARRA are nominally worth $787 billion and address both short- and long-term goals. Jump-starting the economy, saving or creating between three and four million jobs, making college more affordable, weatherizing federal building space, and providing tax credits for children and low-wage workers top the list of immediate goals sought by the bill. Mixed in with these goals are more long-term ones, such as computerizing health records, reviving the renewable energy industry, and modernizing the existing energy infrastructure as well as the physical infrastructure such as bridges, roads, and mass transit construction. In addition to strategic spending, one of the Obama's avowed goals, as enunciated in the bill, is "unprecedented levels of transparency, oversight, and accountability." The government Web site, Recovery.com, is the centerpiece of this program. It supplies current information on federal grant awards and contracts so taxpayers can directly learn how stimulus funds are being spent. Monitoring for Better PerformanceUltimately, government tranparency is about getting government to better perform by reducing waste and inefficiency and eliminating unnecessary spending. As Obama stated in his inaugural address, "The question we ask today is not whether our government is too big or too small, but whether it works—whether it helps families find jobs at a decent wage, care they can afford, a retirement that is dignified. Where the answer is yes, we intend to move forward. Where the answer is no, programs will end." GIS has proved an outstanding tool for performance measurement and management accountability. Maryland governor Martin O'Malley has ably demonstrated the effectiveness of GIS for this purpose. O'Malley, who was then the mayor of Baltimore, Maryland, created an expanded version of a GIS-based program called ComStat. Focused on reducing crime, ComStat was implemented by the New York City Police Department to identify high-crime locations and get resources to those areas.
In 2000, O'Malley began using GIS across city departments as a tool for better government. This approach, called CitiStat, initially focused on cracking down on the rampant absenteeism in the city's workforce. After saving the city $13.2 million in its first year, the program was greatly expanded: the city now uses it to manage all city programs from potholes to parks, and it has saved Baltimore hundreds of millions of dollars. The success of CitiStat has also led to the adoption of this approach by 11 other cities, most recently Washington, D.C. "GIS is an important part of our performance-based approach to government," said Governor O'Malley. "By analyzing our performance in a geographic context, we are able to reduce operating costs, increase revenue streams, and improve the quality of service we deliver to citizens. An efficient government is one that uses resources responsibly and effectively, and this approach to operations helps us achieve that." When O'Malley moved to the governor's mansion in 2006, he took with him his conviction that GIS could make government better and expanded to another level. As governor, he has developed two programs similar in principle to CitiStat. StateStat monitors the performance of state agencies. BayStat helps rehabilitate the Chesapeake Bay by coordinating various efforts and programs and uses data from the departments of Agriculture, Environment, Natural Resources, and Planning. Getting Aid Where It Is Most NeededARRA emphasizes projects that aid short-term recovery and encourage long-term revitalization. The so-called shovel-ready projects included in ARRA are candidates for immediate action that could greatly benefit from GIS. As Jack Dangermond, Esri's president, has noted, "Lurking in the [stimulus] bill are lots of GIS answered questions such as where to build bridges." Analysis of these projects would help prioritize them more effectively to maximize the benefits from these expenditures. Governments and businesses have been using GIS to streamline processes and improve decision making for decades. This technology was originally developed in 1962 to handle a million-acre Canadian land-use/planning mapping project that would not have otherwise been fiscally feasible. The capabilities of GIS have expanded greatly in the intervening years. For example, an Australian energy infrastructure management company called Jemena uses GIS to view its assets relative to utility line crossings, land-use zoning, and rights-of-way, as well as critical or sensitive infrastructure such as airports, schools, or hospitals. Jemena uses GIS to manage a system that supplies gas to more than 1.6 million customers in Melbourne and Sydney. GIS is more than a visualization tool; it is an information system that provides a geographic framework for managing data, understanding phenomena, and modeling solutions. As GIS technology has matured, more powerful tools have been developed, particularly in the area of appropriately applying statistics to geospatial data. These tools generate insights that could not be obtained by other methods, whether the question being answered is why a wetland area is deteriorating or why a particular area has high rates of foreclosure. One of the many ways GIS can better manage organizations is what Dangermond has termed geoaccounting. Society needs to account for "everything people really care about," such as infrastructure, social services, and environmental quality—systematically—and really recognize the cost of human actions. GIS helps uncover and analyze these costs. Through GIS, what should be done can be addressed. StateStat on Steroids
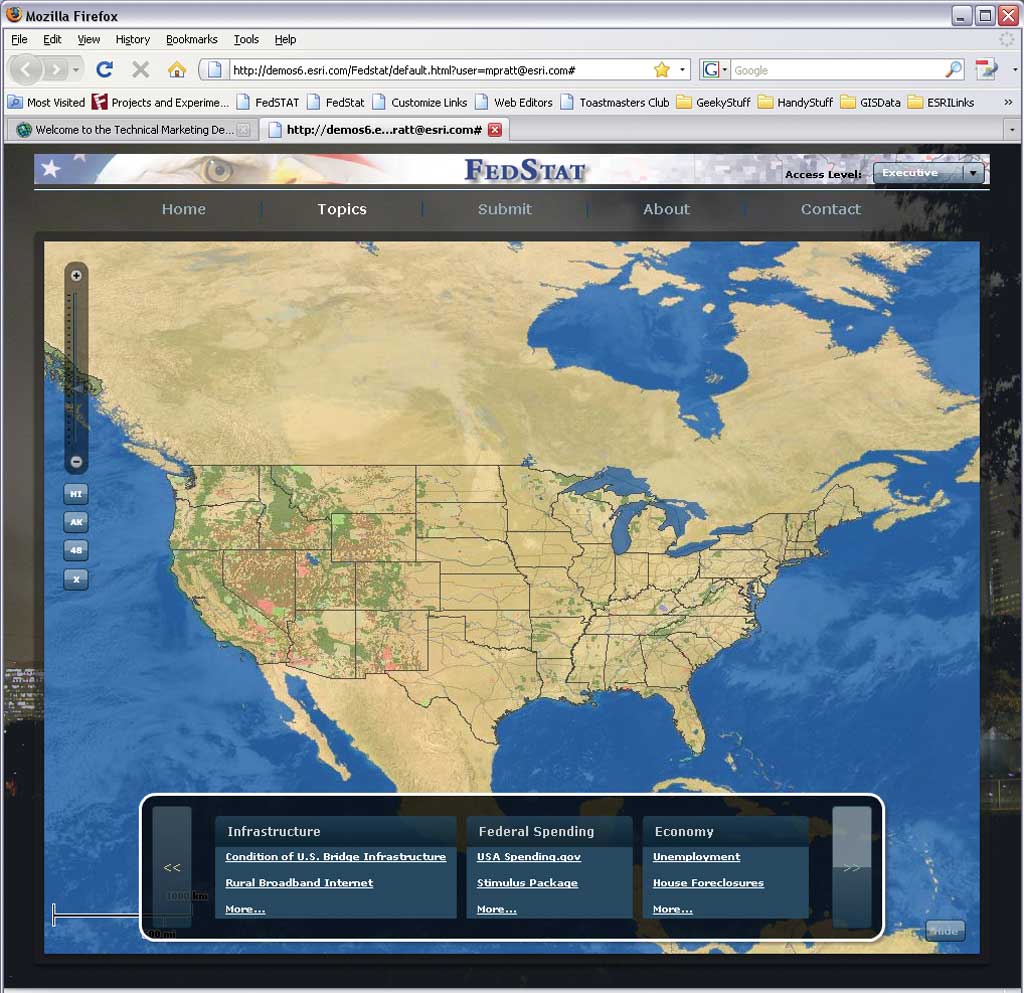
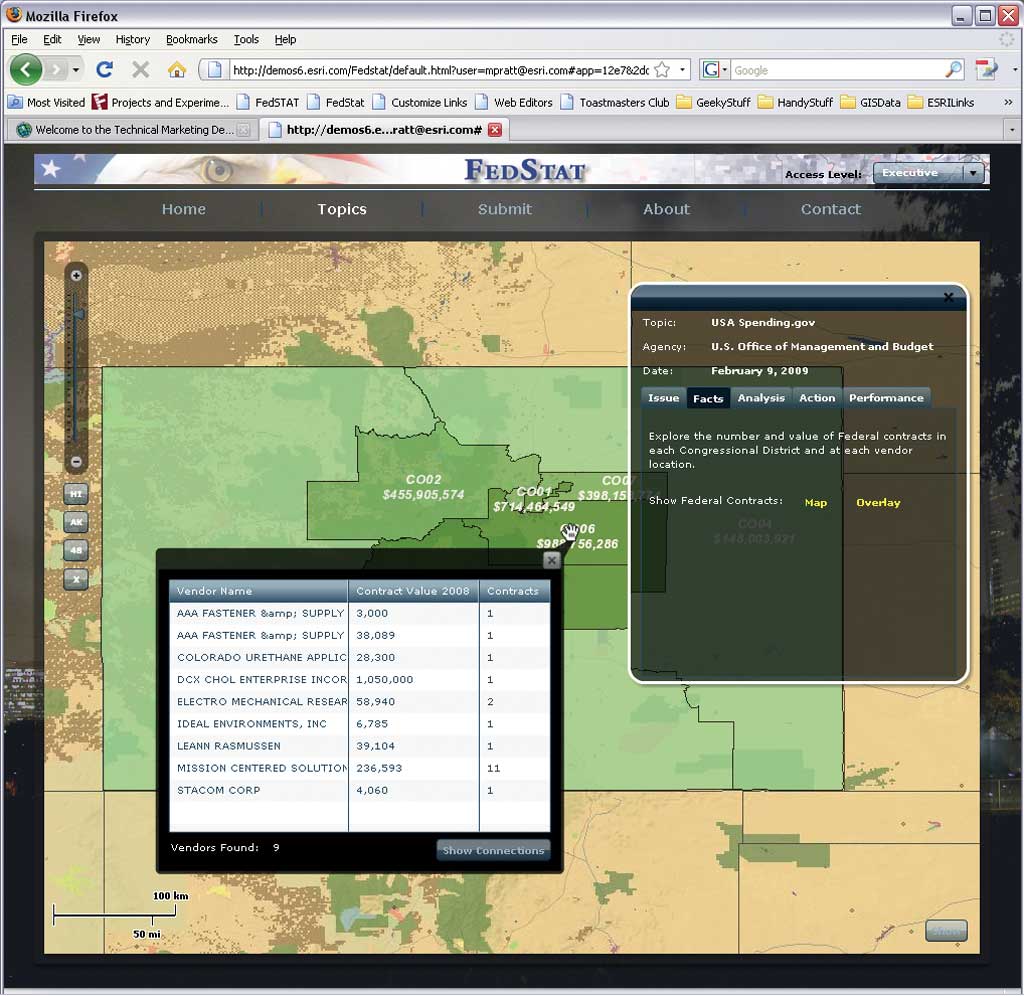
Esri has created a prototype application that supplies geoaccounting for government on the federal level. FedStat demonstrates how GIS can not only visualize Obama's transparent government but also foster informed decision making, accountability, and performance measurement. Through "spatializing" stimulus funds, FedStat offers the next logical step in implementing performance-based governance using GIS to help provide an unprecedented level of government transparency. Developed as a rapid prototype, FedStat takes advantage of the new ArcGIS Server API for Flex and current strategies for delivering highly responsive and focused Web mapping using the capabilities available in ArcGIS 9.3.1. Modeled on the previously cited successful GIS-based programs on city, region, and state levels, FedStat not only shares information but also supports dynamic and interactive analysis in a collaborative environment. FedStat can help government function more effectively by overcoming problems caused by the information silos that result from stand-alone Web applications that cannot share information across agencies. Federal agencies can publish message packets to the FedStat system. Message packets are self-contained dynamic briefings on a topic or issue, complemented by real-time access to Web services that furnish maps and data and provide decision makers with accurate content from domain experts. FedStat doesn't just deliver visualization and communication capabilities, it integrates decision-support tools for performing analysis using cross-cutting data and content. It also incorporates spatial analysis tools that assist in determining the cost to mitigate or solve the problem, its relationship to other similar issues, and how it should be prioritized. For ongoing projects, it can serve as a performance measurement tool for optimizing expenditures and keeping the public informed. A More Insightful ApproachMore than ever, the rational approach supplied by GIS is needed to bring information resources to bear on seemingly intractable problems. As Dangermond has observed, GIS can make the information more accessible and the process more transparent so "mere mortals can see where is the right place and where is the wrong place. If a picture is worth a 1,000 words, a map is worth 100,000 words" because people see maps and intuitively understand the information presented. In this crisis is an opportunity for creating government transparency by incorporating GIS not only for stimulus funding but for all government spending. |