Summer 2009
Summer 2009 |
||||||||
|
|
||||||||
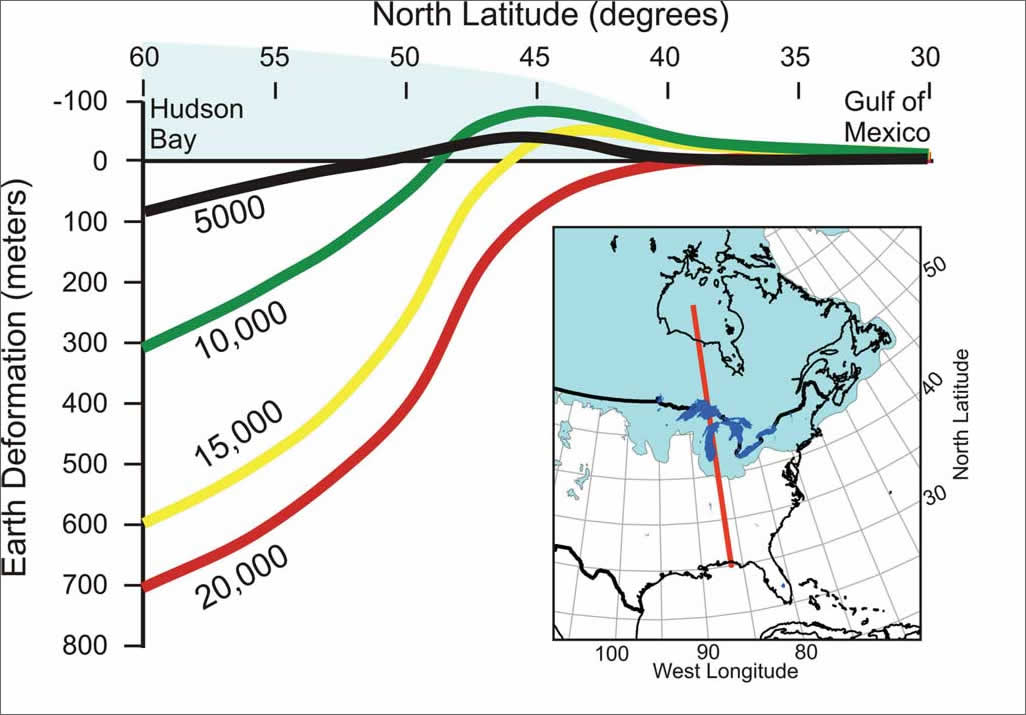
This article as a PDF . Shorelines of the North American Great Lakes during the past 20,000 years were modeled using ArcGIS predictions of earth deformation and the hydrology tools in the ArcGIS Spatial Analyst extension. During historical times, water levels of the modern Great Lakes have fluctuated by more than a meter. This is largely caused by changing weather patterns and the associated rates of evaporation and discharge of rivers and groundwater entering and leaving the lakes. However, when one considers changes in the Great Lakes over the past 20,000 years, the level of the lakes has changed even more dramatically—by more than 100 meters. These changes were caused not only by climate effects, but (more importantly) because the great ice sheet that covered half of the North American continent 20,000 years ago blocked the modern outlets of the Great Lakes, other outlets had to be used. The earth was deformed under the huge weight of the ice sheet, a further complicating factor. The Great Lakes region is between 41 and 49 degrees north latitude, and the ice sheet extended south to about 40 degrees. As the ice sheet retreated northward, outlets became ice free and controlled the level of the lakes. But these outlets were also changing in elevation because the earth was slowly rising to the undeformed position it held in the pre-Ice Age. Creating Paleo-DEMsBased on geophysical theory, it is possible to predict how the viscous mantle of the earth moves under surface loads. In this inquiry, the surface loads included changes in ice sheet thickness over Hudson Bay that were probably in excess of 3,000 meters and accompanied by changes in ocean loads as the melting ice sheets caused the ocean level to rise by approximately 100 meters.
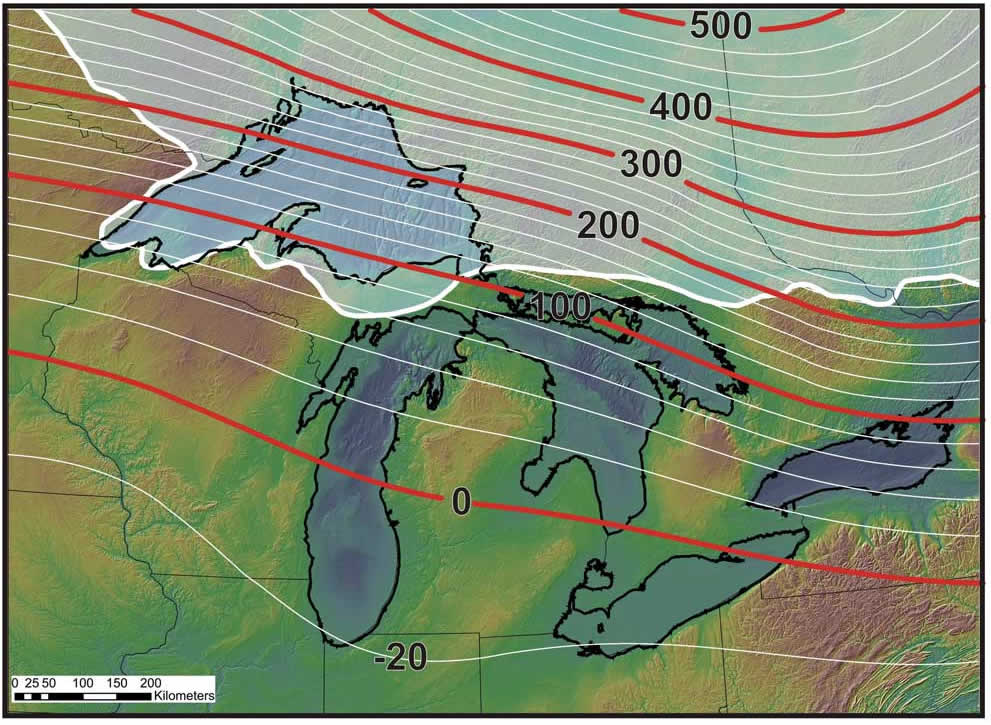
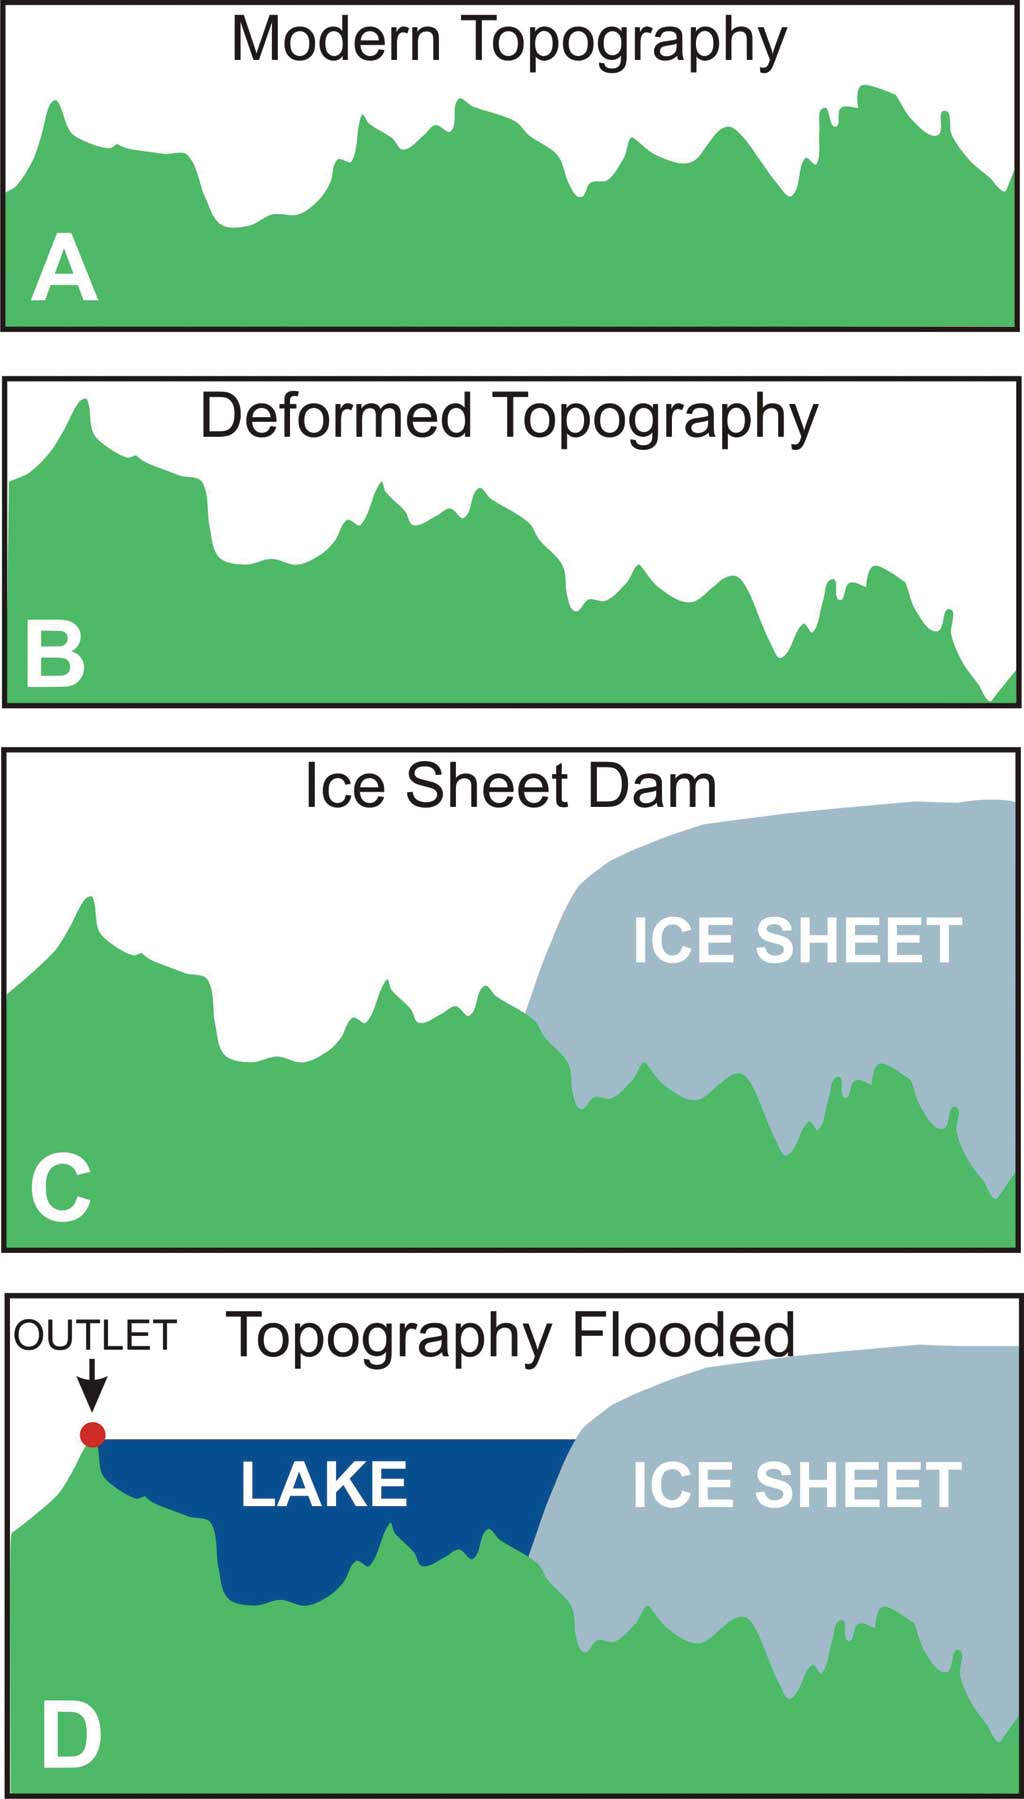
Taking all time-dependent loads and the viscosity structure of the mantle into account, numerical geophysical models can predict the vertical deformation anywhere on the earth at any time during the past 20,000 years. As ice advanced over the Great Lakes region, the earth surface under the ice subsided, while the region beyond the ice bulged upward. In general, as the ice retreated, the process occurred in reverse. The land rose under the melting ice but subsided in regions near the ice sheet margin. For any time period, the geophysical model can predict deformation at hundreds of discrete points over the Great Lakes region. These discrete predictions can be interpolated using the spline interpolation methods, available in the ArcGIS Spatial Analyst extension, to yield a deformation raster at each time of interest. Just as the locations of modern rivers and lakes are a result of topography, so too did topography in past ages control surface hydrology. To determine past topography, the deformation raster map was subtracted from a modern digital elevation model (DEM). The Shuttle Radar Topography Mission (SRTM) DEM was used over the land areas and combined with Great Lakes bathymetry data from the National Geophysical Data Center of the U.S. National Oceanic and Atmospheric Administration (NOAA). Because the bathymetry dataset was not complete, it was supplemented with Lake Superior bathymetry provided by the Large Lakes Observatory of the University of Minnesota. To speed calculations, the raster resolution was changed from 90 meters to 200 meters. The result was a series of Paleo-DEMs that spanned the last 20,000 years.
Mapping Great Lakes HistoryThrough extensive fieldwork, geologists have determined the extent of the ice sheet as it retreated from the Midwest. Maps of the ice sheet extent were digitized. The ice sheet north of the margin was assigned an arbitrary thickness of 1,000 meters. By adding ice sheet raster maps to the Paleo-DEMs, the actual topography during late-glacial and post-glacial times was re-created. With this topography, the hydrology tools in ArcGIS Spatial Analyst were used to determine paleohydrology. A first step in modeling modern hydrology, given a DEM, is usually to fill any closed depressions in the topography to correct for any small imperfections in the DEM that would incorrectly serve as sinks for water. In the present application, these filled depressions are critical to the solution because the lakes that formed on the ancient landscape are exactly those that result from filling the Paleo-DEM. Subtraction of the Paleo-DEM from the filled Paleo-DEM yields a raster of Paleo-lakes and their bathymetries. Not only can the ancient distribution of lakes and shorelines be predicted but so can the volumes of those lakes. Using the Hydrology Flow Accumulation tool, which determines the number of raster cells above a given cell that would contribute overland water to that cell, the locations of ancient stream channels could be predicted on the filled Paleo-DEM. In addition, the outlet of each lake was located. It was identified as the single raster cell on the margin of each lake with the highest flow accumulation value. While the locations of hundreds of lakes are predicted for each time period, most of these lakes are very small. To limit the analyses to the largest lakes, the paleolakes raster was searched for all lakes with contiguous areas larger than a specific minimum area. These steps were automated using a Python script. A record of the 20,000-year history of the Great Lakes was produced after only about three days of computational time on a PC.
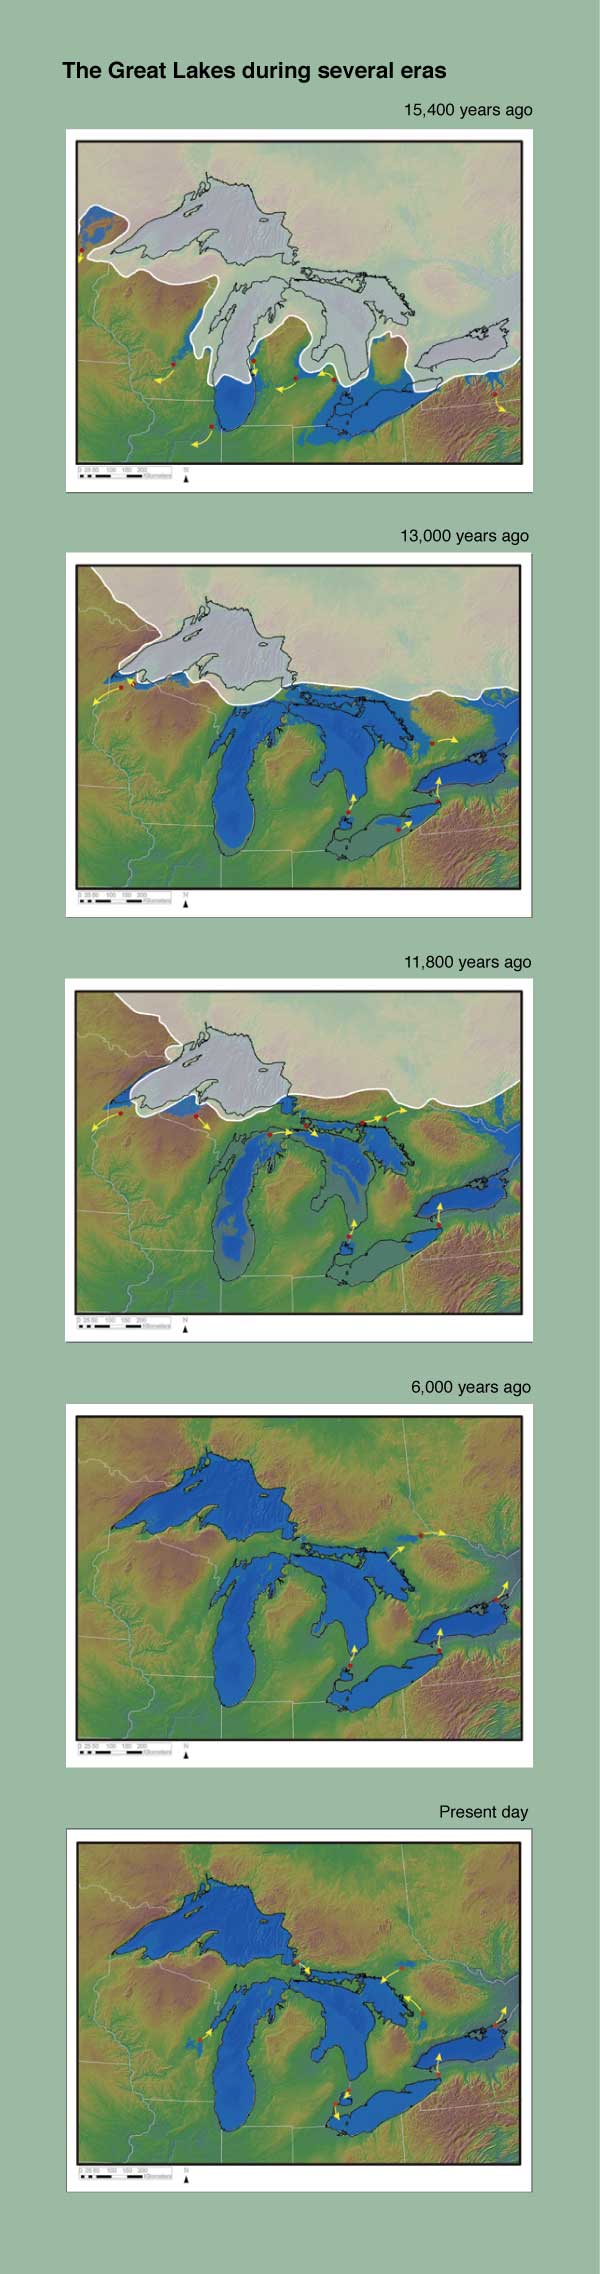
Modeling ResultsWhen ice covered much of the Great Lakes basin, water flowed out through Chicago, down the Illinois River, and into the Mississippi River. When ice had retreated north of the Great Lakes, an outlet in Canada that had been depressed under the weight of the ice became the lowest outlet. It captured the drainage as soon as the outlet became ice free. This caused the lakes to drain rapidly. Lake Michigan, which experienced a 125-meter drop in lake level, became separated from Lake Huron. Subsequently the northern controlling outlet rose as the earth readjusted to the reduced load of the melting ice until the outlet reached the same elevation as the more southern outlets. When that happened, drainage of the Great Lakes shifted to the south and the modern outlets. Lake Erie, which almost drained completely because its northern outlet was low, gradually filled as its outlet slowly rose to its present position. ConclusionThese lake-level predictions were suggested by a century of fieldwork by geologists mapping old shorelines of the Great Lakes. (This work is summarized in Jack L. Hough's classic work, Geology of the Great Lakes.) These geologists observed that ancient shorelines were tilted relative to modern shorelines and attributed the tilting to earth deformation forced by ice sheet loading. The results of this analysis demonstrated that when the physics of viscous mantle flow is combined with ArcGIS methods, these ancient shorelines can be reproduced. Using this GIS methodology makes it possible to verify shoreline positions by uploading shapefiles of the predicted shoreline to ArcPad installed on GPS units and locating shorelines in the field. Differences between the observed and predicted locations suggest how the geophysical model should be improved, either by altering the viscosity structure of the earth model or adjusting the ice sheet thickness chronology. For more information, contact James Clark AcknowledgmentsThis work was funded by grants from the National Science Foundation (NSF Grants EAR-0414012 and EAR-0624199), the National Aeronautical and Space Administration (NASA Grant NAG5-10348), Wheaton College, the Wheaton College Alumni Association, and the United States Geological Survey National Cooperative Geologic Mapping Program. Tom Hooyer provided encouragement and insight throughout this work. Steve Colman and Shiyong Yu kindly provided their unpublished Lake Superior bathymetry data. About the AuthorsJames Clark is a professor of geology in the geology and environmental science department at Wheaton College in Wheaton, Illinois. In addition to the Great Lakes studies, his research interests include global sea level changes and water supply problems in developing nations. His Ph.D. is from the University of Colorado. Kevin Befus is now using shallow surface geophysical methods to characterize the Boulder Creek Critical Zone Observatory while pursuing a master's degree at the University of Colorado in Boulder, Colorado. ReferencesCathles, Lawrence M. (1975), The Viscosity of the Earth's Mantle. Princeton, NJ: Princeton University Press. Dyke, Arthur S. (2004), "An Outline of North American Deglaciation with Emphasis on Central and Northern Canada." In Quaternary Glaciations—Extent and Chronology, Part II, J. Ehlers and P. L. Gibbard, eds. Amsterdam: Elsevier, Developments in Quaternary Science, Vol. 2b, 373�424. Farrell, W. E., and James A. Clark (1976), "On Postglacial Sea Level." Geophysical Journal of the Royal Astronomical Society 46:647�667. Hough, Jack L. (1958), Geology of the Great Lakes. Urbana, IL: University of Illinois Press. Peltier, W. R. (1974), "The Impulse Response of a Maxwell Earth." Reviews of Geophysics and Space Physics 12:649�669. Wu, P., and W. R. Peltier (1983), "Glacial Isostatic Adjustment and the Free Air Gravity Anomaly as a Constraint on Deep Mantle Viscosity." Geophysical Journal of the Royal Astronomical Society 74:377�450. Esri TrainingAn instructor-led course, Working with ArcGIS Spatial Analyst, is offered. Visit www.esri.com/training for dates and locations. |