Spring 2008
Spring 2008 |
||||||||
|
|
||||||||
Sports are geographic activities. Because sports have geographic characteristics, patterns, and movement, GIS can be used effectively in
Here are just a few of the sports questions that can be posed in a GIS environment:
Mapping and analyzing the locations of radio station affiliates in the Kansas City Royals and St. Louis Cardinals baseball network in ArcGIS opens up areas of spatial analysis and encourages spatial thinking. While Missouri has radio stations that broadcast the Royals games as well as those that broadcast the Cardinals games, Kansas is exclusively the domain of the Royals' radio network. Students can measure the areal extent of each team's radio coverage, or "catchment area," and compare these measurements with those for other teams.
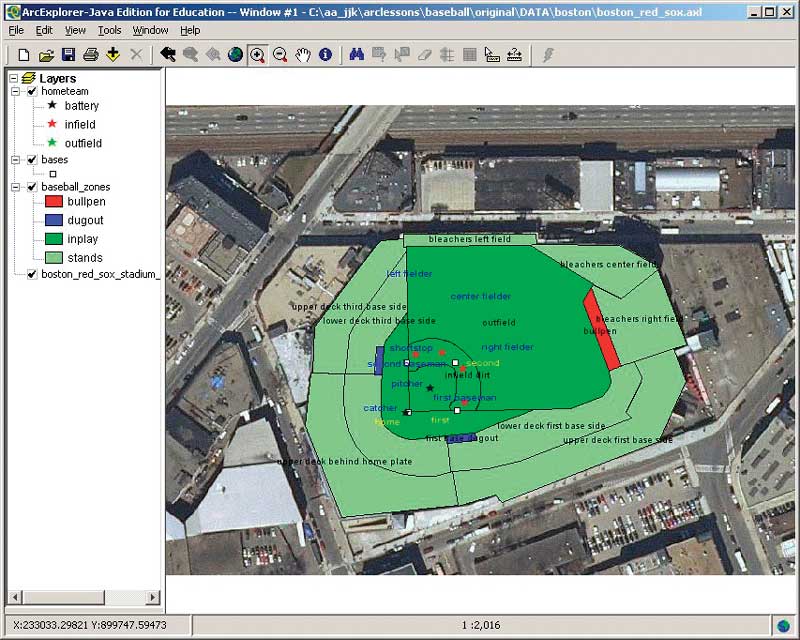
For example, the catchment area for the Milwaukee Brewers is smaller, sandwiched between the Minnesota Twins and the two Chicago teams, the White Sox and the Cubs. Students can draw what they consider the "boundary" between the two teams, noting those cities where one station broadcasts the Royals games, and another station broadcasts the Cardinals games. Some boundaries, such as the one dividing these catchment areas, are fuzzy, even in Missouri. The students can plot the location of surrounding teams, noting where those teams carve into the Royals' and Cardinals' territory. Cardinals' stations abruptly end in northeastern Illinois where the domain of the White Sox and Cubs begins. The Royals' western sphere of influence extended far into western Colorado until 1993, when Denver was granted the Colorado Rockies franchise. Colorado radio stations then switched affiliation from the Royals to the Rockies, but the absence of a team in the western north central part of the country means that some South Dakota and Wyoming radio stations are part of the Royals' network. Students can also investigate the relationship between the size of a city and the presence of a baseball affiliate radio station and compare the diffusion of baseball fans as opposed to the diffusion of radio stations in the network. A GIS-based lesson about the World Series of baseball uses maps of Fenway Park in Boston, Massachusetts, and Coors Field in Denver, Colorado. The 2007 World Series was played in these two stadiums. In this lesson, students explore the different zones in a baseball stadium from the infield to the outfield to the stands, study the direction the players face in both stadiums, and consider the effect of the setting sun on batters and players in the infield and outfield. They measure distances on each field and speculate which stadium as well as which side of the field (left, center, right) would be easiest to hit a home run.
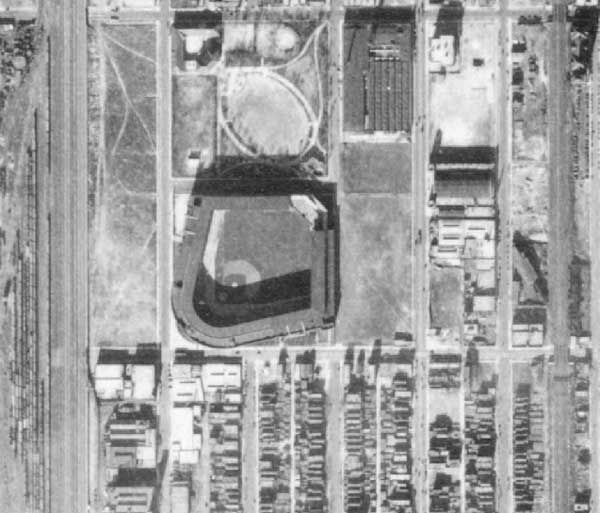
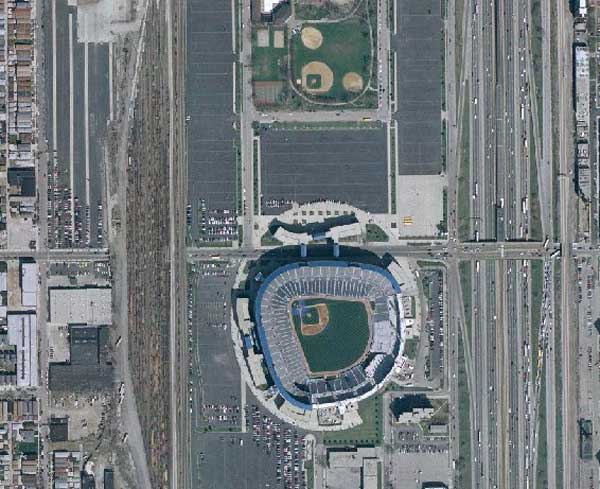
This lesson uses ArcExplorer—Java Edition for Education, but it can be modified to use ArcGIS with football, soccer, rugby, lacrosse, track, swimming, or other sports scenarios. Neighborhoods change, and so do the stadiums in them. Consider the location and orientation of Comiskey Park, home of the Chicago White Sox, in 1938 compared to the stadium in 2002. By then, the stadium was located on the other side of the street, faced south, and was named US Cellular Field. Looking at the accompanying photos of the White Sox's home field, note the size of the parking lots in both images and the rail line running north�south along the eastern edge of the images. How do you think most people commuted to the stadium in 1938? In 2002? How did the expansion of the sports arena affect the neighborhood land use, housing, and sense of place? Background information for creating sports-based GIS lessons is everywhere. Data on the teams, players, fans, and recruitment exists and sometimes only takes a bit of manipulation to bring it into a GIS.
For ideas on what to model with sports and how to think spatially about sports, see Sports Geography by John Bale. In this book, Bale explores the geographic diffusion of modern sports; its economic impact; cultural geographies of sport; and landscape, place, and location. The book is available from the publisher Routledge and online through Google Book Search. Sports Illustrated Sports Atlas, published in December 2004, gave an excellent overview of the power of mapping and GIS in sports that was summarized in the February 8, 2005, issue of Directions magazine. Students at all grade levels are interested in sports. Help students see the advantage of the geographic approach and dig into GIS-based analysis beginning with a topic that is already interesting to them. Be creative and use GIS to uncover new geographic relationships on a myriad of scales. |