July - September 2007
July - September 2007 |
||||||||
|
|
||||||||
People are moving back into urban centers, and the demand for infill housing in U.S. cities is on the rise. According to the Urban Land Institute, the factors influencing this trend are varied but include disillusionment with life in the suburbs—where traffic, crime, and pollution are increasing—and the appeal of an urban lifestyle, where residents have easy access to restaurants, cultural attractions, and work. Dramatic increases in population also have city planners thinking more about infill development projects. According to the U.S. Census Bureau, Los Angeles is ranked second in the list of incorporated places with a population of 100,000 or more. The city gained more than 209,000 people between 1990 and 2000. According to the Southern California Association of Governments (SCAG), by 2014, the city of Los Angeles will need 112,876 new housing units.
Another factor influencing infill development in Los Angeles is construction of the Exposition Light Rail Line, a mass transit line planned to relieve congestion on Interstate 10 between downtown Los Angeles and Culver City. According to the paper, "Exposition Line Infill Development Potential Analysis," by Solimar Research Group, (SRG) Inc., of Ventura, California, there is an "increase in interest among both policy makers and developers in stimulating transit-oriented infill developments. However, it is not always easy to identify promising infill sites and not always clear to policy makers which infill- or transit-oriented policies are likely to succeed in stimulating development." The planners of the Los Angeles Department of City Planning (DCP) use GIS technologies to help them assess property characteristics and make decisions about land use and development. During the last eight years, DCP has used the Zone Information and Map Access System (ZIMAS), an Internet-based GIS that utilizes Esri's ArcIMS to access a parcel database consisting of nearly a million records. Originally developed in 1998 using MapObjects, ZIMAS was rewritten by the current principals of Altruvista LLC in 2003 using ArcIMS 4. [Altruvista is a GIS technology company based in San Diego, California.]
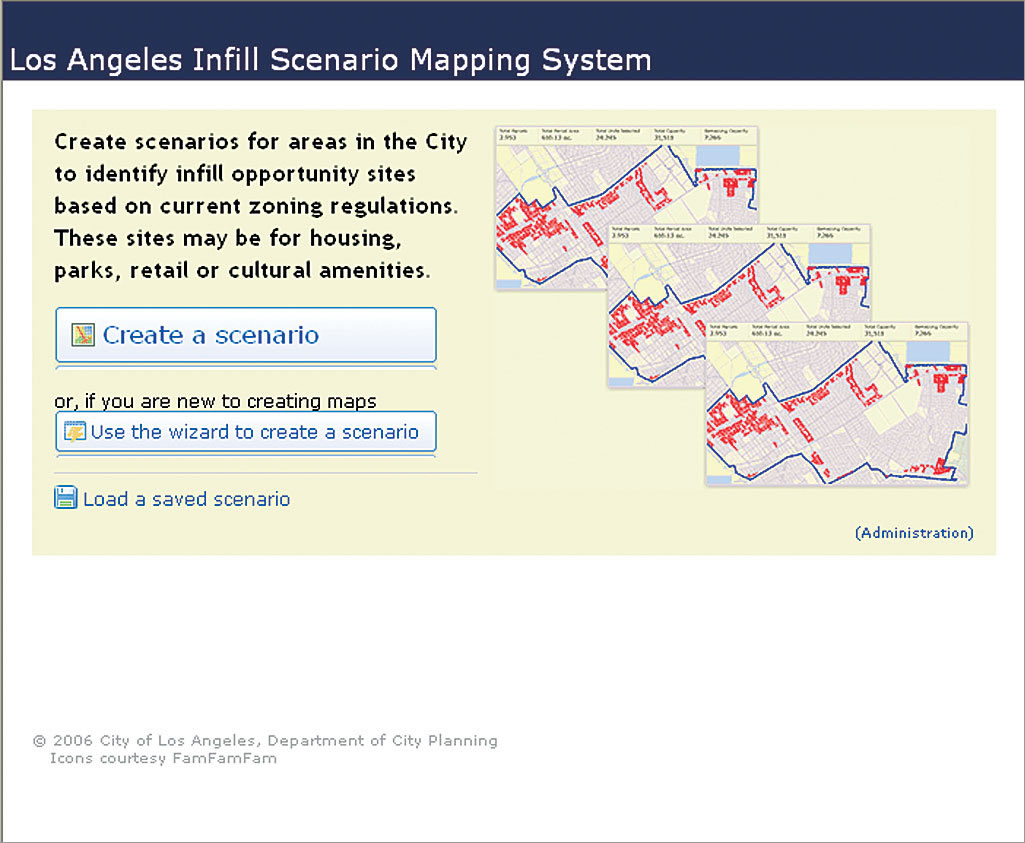
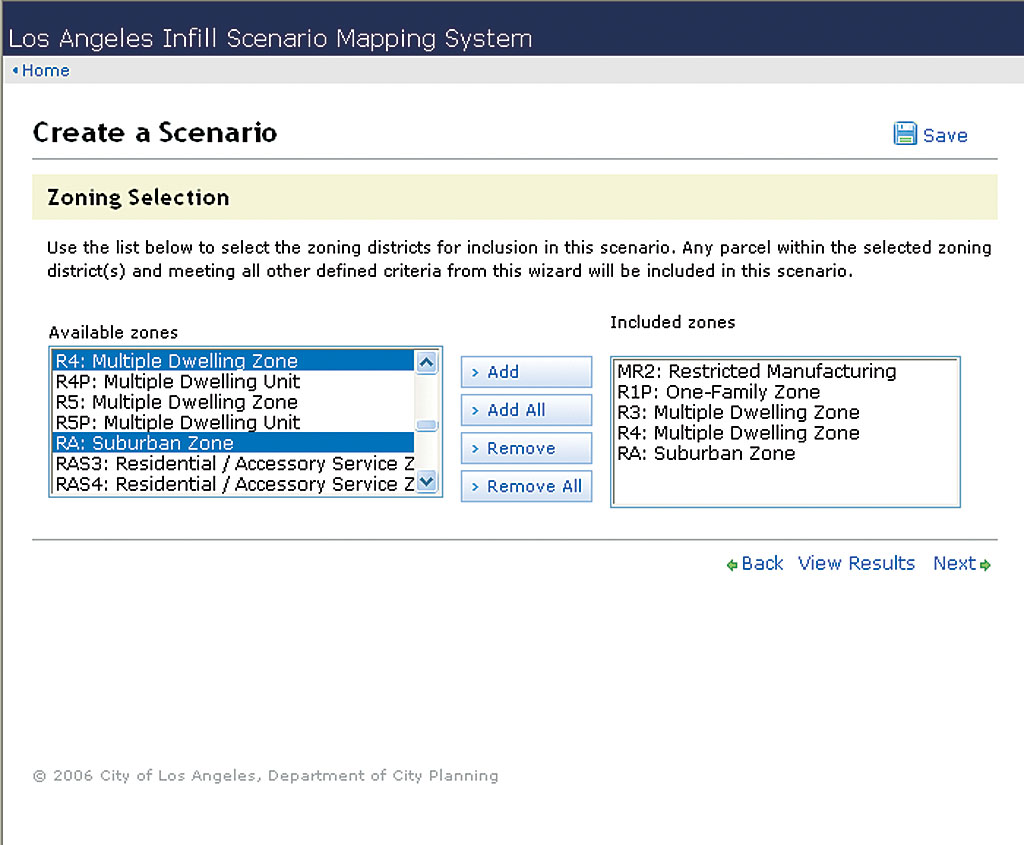
ZIMAS was designed to help planners and others quickly access property information using a Web browser. Policy makers use ZIMAS to analyze zoning and parcel information for patterns to make better use of limited land resources. Its data is stored in Oracle databases, and the system generates an extensive report for each property. A property can be located by entering its address, assessor parcel number (APN), or legal description. Users can also search by entering a street intersection, legal description, case number, community plan area, or map sheet number and visually searching properties displayed on the map. The public can access ZIMAS at zimas.lacity.org. To address SCAG's housing demand projections for 2014 and other issues, such as Exposition Light Rail Line development, city planners at DCP required a more agile solution for identifying potential infill housing opportunities that would take advantage of the ZIMAS database. They needed to evaluate the infill housing potential of underutilized land by screening larger areas, such as census tracts, community planning areas, and city council districts. Instead of researching one parcel at a time, DCP wanted to find all the parcels that met explicit criteria but base the analysis on existing boundaries, both geographic and political, and linear features, such as roads or exact locations such as commuter rail station stops. Identifying a Better SolutionIn 2005, DCP turned to SRG to develop a Web-based application that would help planners visualize infill housing potential based on information stored in the ZIMAS inventory. Jane Blumenfeld, senior planner and head of the Citywide Planning Division, and John Butcher, project manager for DCP, worked with SRG to develop a pilot product as a proof-of-concept for DCP. In 2006, SRG was contracted by the City of Los Angeles to develop the Infill Scenario Mapping System (ISMS) based on the prototype application. SRG subcontracted with IGIS Technologies, Inc. (IGIST), of San Diego to develop the product. IGIST supplied project management services and tested the application, hosted the application during the development phase of the project, wrote the manuals for the final product, and was responsible for assembling the final deliverables. Initially, the development team considered using ArcIMS 9.1, the same geo-enabled Web component used for ZIMAS. However, after testing, IGIST began encountering limitations in two important areas—buffering and queries that returned large result sets. The team found that a query could potentially return hundreds of thousands of records, and initial tests indicated that ArcIMS was not up to this task. In addition, a specific scenario caused problems. If the boundary of the zoning layer (one of the primary search criteria needed for the application) touched a parcel boundary, an error would occur. Although these problems could be solved—at least partially—using unsupported workarounds, the team believed in the long run this would put DCP at risk. However, the development team learned ArcGIS Server 9.1 could easily handle large query results. A negative buffer could be programmed into queries, thus avoiding the boundary error experienced with ArcIMS. DCP had specified that the application be built on .NET. With ArcGIS Server 9.1, the team could incorporate Microsoft ASP.NET AJAX (formally Microsoft Atlas) and Yahoo User Interface (UI) Library utilities and controls that would improve the Web application's interactivity and speed and the user's overall experience. DCP, IGIST, SRG, and Altruvista decided that ArcGIS Server would be the best GIS component for taking advantage of the comprehensive ZIMAS databases and building what would eventually become ISMS. How It WorksWith ISMS, planners can formulate parametric queries against the ZIMAS inventory to find parcels that meet a particular range of requirements for infill housing potential. Using a Web application, the user creates a scenario by filling in a form and submitting it or stepping through a wizard that explains how the input parameters affect resulting scenarios. Scenarios, created from previous queries and saved as XML files, can be loaded and shared among city planners.
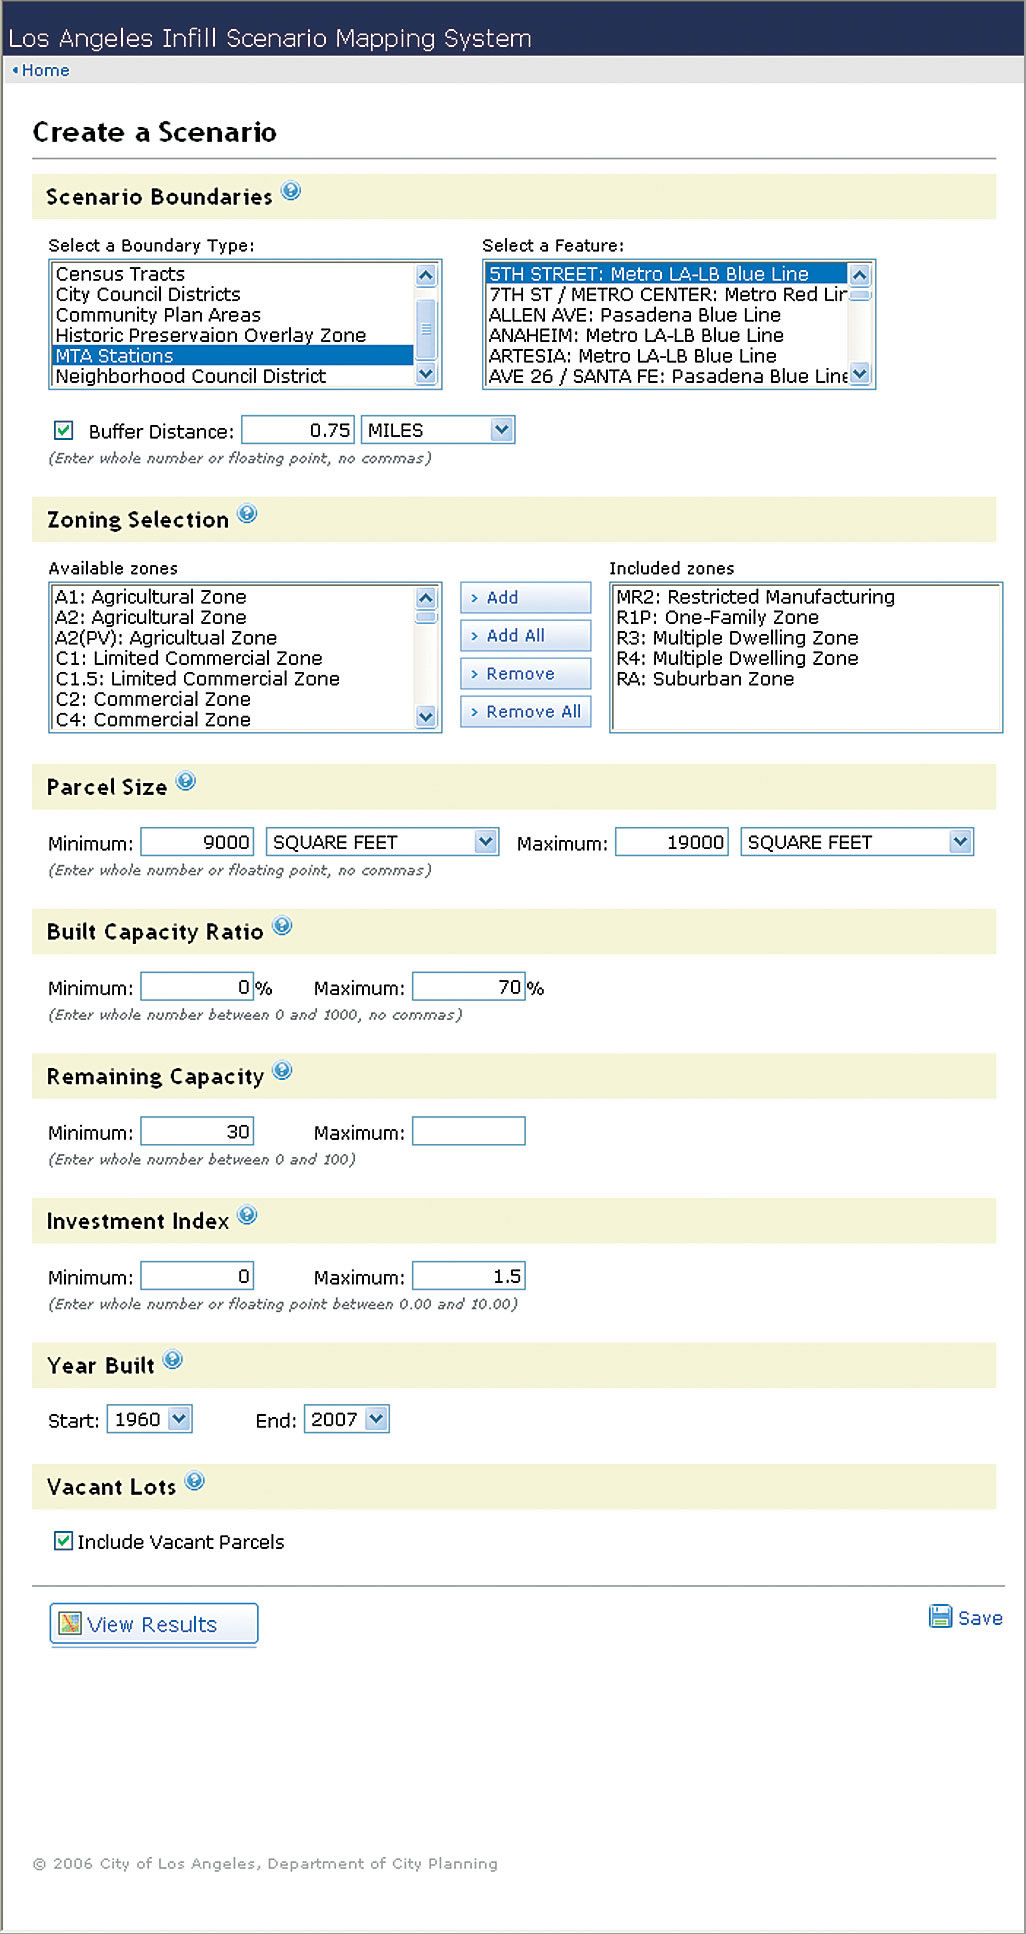
To create a scenario, the user chooses a boundary type from a drop-down list. Current boundary types for the Los Angeles application include Area Planning Commission, Census Tracts, City Council Districts, Community Plan Areas, Historic Preservation Overlay Zone, or MTA Rail Stations. The next step is to select a boundary area. For example, for an Area Planning Commission boundary type, one of seven Area Planning Commission areas must be selected. Regardless of the feature type (polygon, line, or point), the scenario creator can buffer the selected feature by a specified distance. For example, a scenario could be built that would find all the parcels within 1,320 feet (or approximately a quarter of a mile) of a selected rail station. The parcel characteristics that define infill housing potential must be established. These characteristics, drawn from the parcel attributes (the same information used by ZIMAS), include zoning districts, parcel size, built capacity ratio, remaining capacity, investment index, year built, and vacant lots.
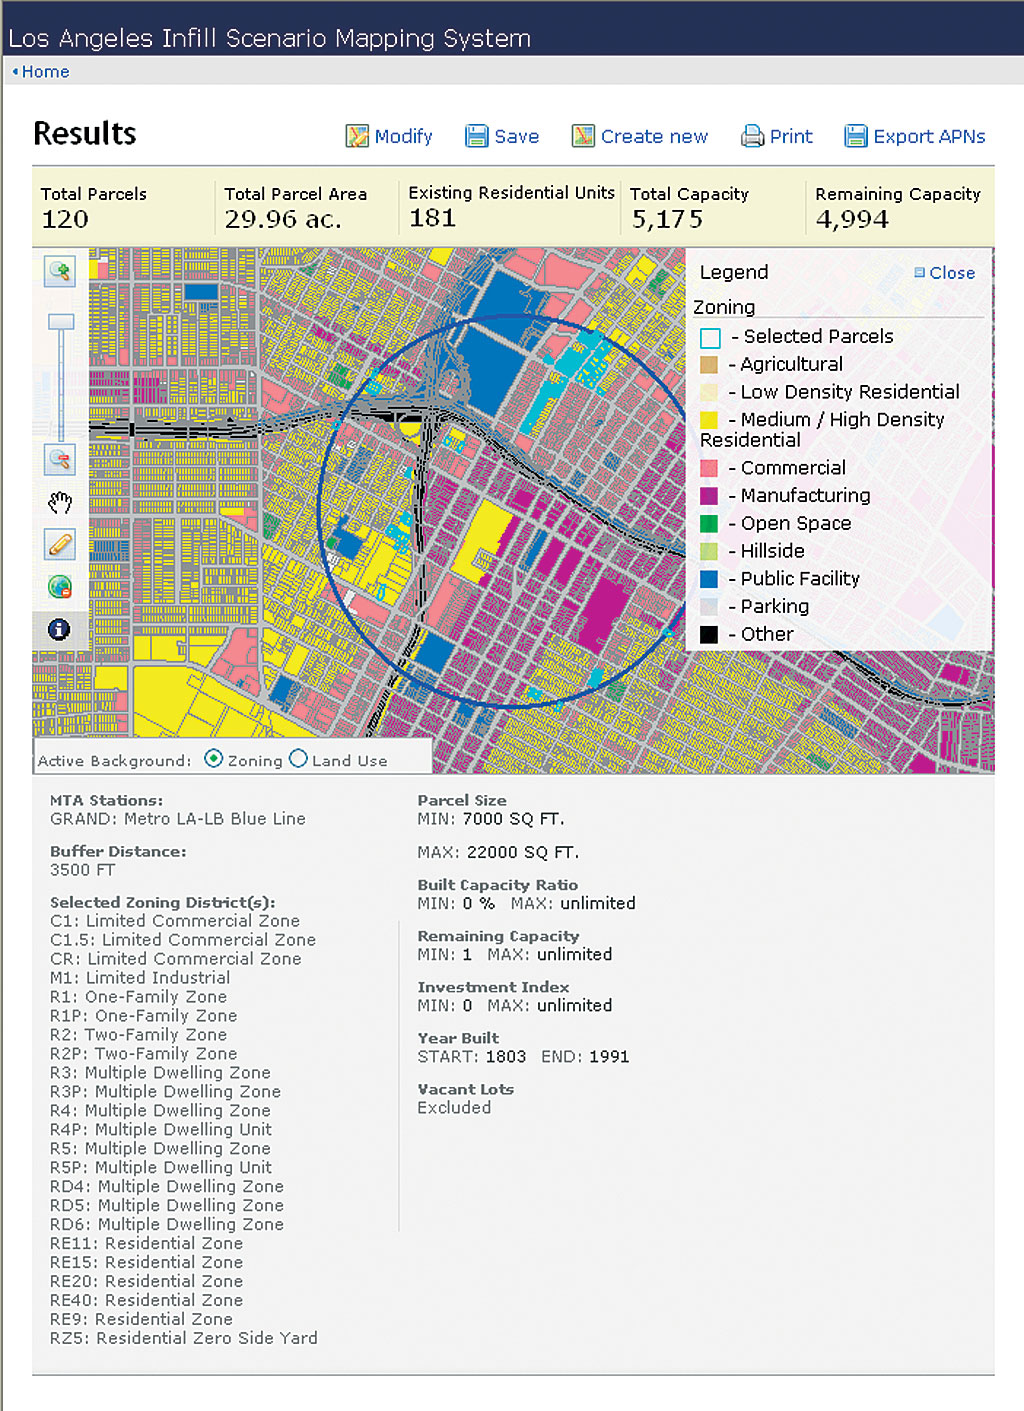
Saved scenarios can also be modified later. Once a scenario is submitted, the application queries the ZIMAS parcel database using the scenario parameters and reports the results back to the application. Parcels matching the parameters are highlighted on a map and a corresponding report of summary statistics displays above the map. Below the map, the search parameters are listed. The APNs of highlighted parcels can be exported to a comma-delimited text file. Scenario results can also be printed.
The View Results page includes tools for navigating the map. The Draw Polygon tool can be used to refine the search area or create a new area. Drawing a polygon on the map automatically reruns the search (using the same parameters) based on the geographic area defined by the polygon. ISMS includes administrative tools for connecting to different servers and datasets that make the system flexible and reliable. DCP currently uses two servers on a rotating basis to support the constant updating of ZIMAS data. ISMS can be reconfigured to point to the server containing the most current ZIMAS data. Benefits Beyond Infill"Before this system was in place, we might figure out what we think is the best infill housing scenario, for example, then ask the GIS Department to map the result for us so we could present the idea to a group of citizens. It was just not a good use of the GIS Department," said Blumenfeld. "Now, planners can test out a number of infill scenarios themselves, which takes some of the workload off the GIS Department. We can easily identify the best idea and print it out to present to communities." Planners testing the beta versions of ISMS realized it had potential for helping with other issues. For example, the same parameters could be used to identify possible sites for parks, community facilities, or cultural amenities. Creating scenarios that identify areas where housing is well developed could be used to help attract employers and businesses. As ISMS matures, Blumenfeld envisions additional opportunities to communicate with Los Angeles citizens. "We are always updating community plans, and we can use this system as a community outreach tool—to help us quickly create what-if scenarios within the context of a public meeting," she said. "For example, we can model scenarios for potential pilot projects that may not work for the entire city but might work very well in certain portions of the city, like increasing population density near transit or adding a second unit on a single-family lot or adding a story to a building where there is a height limit. We're able to test it out and calculate how much more housing we could generate with these types of strategies before making policy changes." Blumenfeld sees infill scenarios as the first step to more in-depth analysis, where "you can see right off the bat how effective a policy change might be before going through a lot of work to get an ordinance passed, then discovering it doesn't generate the volume of new housing results you were hoping for. This way, you can visualize where there is significant infill housing potential and where there is not." ConclusionISMS leverages the massive parcel inventory of ZIMAS and makes GIS functionality available to as many as 200 planners at DCP through a Web browser. These planners don't need GIS software on their desktop computers and don't have to be GIS experts—all they need is a network connection. ISMS provides new ways to look at existing data quickly and precisely. Planners can evaluate current conditions within areas of interest and tease out additional information. "The Infill Scenario Mapping System boils down a complex problem into a simple map product," said Andres Abeyta, president of IGIST. "It uses ArcGIS Server to take advantage of the city's significant and long-term investment in GIS data (namely ZIMAS), placing Web browser-based analysis tools directly in the hands of city planners, community groups, and elected officials." About the AuthorsDavid Van Mouwerik, sales and marketing manager for Esri business partner and Authorized Developer IGIST (www.igist.com), is a long-time member of the Esri Authorized Training Program. He has worked in the GIS industry for the last 15 years and acted as the project manager for the ISMS development project. He can be reached at vanmouwerik@igist.com. Keith Mann is a writer for the Esri Government Industry Solutions team and a contributor to ArcUser. He has a background in urban and regional planning and used GIS while working for the Bureau of Land Management and the U.S. Forest Service. He can be contacted at kmann@esri.com. |