Boosting Fieldwork Productivity with Photomaps
By Rick Bobbitt, GeoSpatial Experts, and Cady Johnson, GeoLogic VR, LLC
Approach improves field investigations efficiency
 |
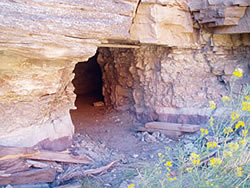
| The Moss Back Member of the Chinle Formation, a known host for uranium mineralization. |
Remote sensing, digital maps, and GIS technologies have greatly facilitated geologic mapping, but these technologies have not replaced the need for on-site fieldwork. Geologists continue to spend days in remote locations examining outcrops, sketching formations, and collecting data samples. Fieldwork can be both time consuming and error prone, especially when sample data must be manually recorded, organized, and transcribed.
GeoLogic VR, LLC, a geosciences firm specializing in exploration, monitoring, and visualization services, devised a method that significantly improves the efficiency and accuracy of geologic fieldwork by making a radon survey essentially paperless. The firm used GPS photomapping as a digital field data collection technique. A digital camera was used as a field notebook for the geologist by rapidly associating photographic field observations with sample identification and location data that can be processed using GIS with photomapping software.
In a recent uranium exploration project in Colorado, the photomapping technique dramatically increased the volume and quality of data that could be collected in the field each day. It eliminated problems with the clarity and consistency of site descriptions; errors caused incomplete or illegible notebooks; and the time-consuming transcription of notes that can plague team efforts in the field. The project was carried out for Atomic Minerals, Ltd., a junior mining company traded on the TSX Venture Exchange (symbol: ATL).
Exploring for Uranium
To evaluate two leases in southwestern Colorado as possible uranium mining sites, an investment group contracted GeoLogic VR. The firm has many years of experience in uranium exploration. The geosciences firm proposed conducting a radon gas survey of the 30-square-mile properties to pinpoint promising locations for further exploration. In this project, concentrations of radon gas at the surface would be correlated with other geologic data to determine where underground uranium ore bodies might be located.
The theory behind the survey is that underground uranium ore releases radon gas during its natural decay. Because the half-life of this gas is just four days, it generally reaches the surface from relatively shallow depths. However, at the study area, the target horizon was at depths in excess of 1,000 feet, but barometric pumping along natural fractures was thought to provide a mechanism for delivering the radon signal to the surface before it was eliminated by radioactive decay. The goal of the survey was to map radon gas concentrations across the properties using geostatistics.
The geosciences firm created a GIS for the project area in ArcView by obtaining aerial photos as well as digital geologic and topographic maps. A geologist analyzed the air photos and identified numerous lineaments [i.e., major topographical features that provide information about the subsurface] running in several preferred orientations through the sites. Surface lineaments often indicate the presence of faults and fractures. With these features located in the GIS, the team overlaid the lineament layer on the topographic map and selected target points for placement of the radon detectors. A total of 1,000 alpha-track radon monitors were placed in the field in arrays of nine detectors designed to facilitate analysis of spatial variations in the data. [When radon atoms decay, alpha particles are released.]
Most target array centroids were chosen directly on a lineament and were separated by about one kilometer. Nine sensors were placed in a radial array around each target point at distances of one, 10, and 100 meters from the centroid. As a control, several additional arrays were deployed at strategic locations where soil geochemical analyses were available. The teams precisely mapped every sensor location before venturing into the field.
Selecting Photomapping Equipment
In preparation for the fieldwork, GeoLogic purchased two Trimble Geo XM mobile GIS devices and equipped each with ArcPad software. These mobile GIS devices are handheld data collectors with built-in GPS receivers capable of real-time differential correction via the Wide-Area Augmentation System (WAAS). Each field team uploaded the raster feature layers from ArcView into ArcPad to take the GIS data into the field.
Two other important purchases were Ricoh Pro G3 digital cameras and GPS-Photo Link photomapping software from GeoSpatial Experts of Thornton, Colorado. Although the photomapping software can georeference photographs from any digital camera, the Ricoh G3 model was selected for this project because it is designed for data collection. The camera allows the user to enter up to five attributes for each photograph and store them on a removable secure data (SD) card. These attributes can be input directly on the camera keypad or received wirelessly from another Bluetooth-enabled device such as the mobile GIS unit. Attributes can be text descriptions, GPS coordinates, or bar codes.
The geosciences firm obtained 1,000 radon detectors. Each detector is roughly the size and shape of a hockey puck. The manufacturer, RSSI of Morton Grove, Illinois, delivered the detectors with unique serial numbers identified by bar code strips on their plastic housings.
Photomapping in the Field
 |
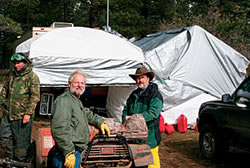
| Crew members Mike Leavitt, Tom Ferguson, and Vernon Rich secured the base camp for harsh weather. |
The teams arrived in the field and established a base camp in September 2006. Two factors—the imminent onset of winter weather and the location of most of the project area at an elevation of more than 8,000 feet—made working quickly imperative. The two crews used the topographic map and lineament overlays displayed on the mobile GIS devices to navigate through the dirt roads and thick brush to each target location. Although the terrain was relatively flat overall, incised drainages and mud, rocks, and vegetation presented challenges.
The GPS guided the teams to the preselected detector placement spots with one- to three-meter accuracy. At each placement, a technician unwrapped the detector and scanned its bar code with the digital camera. After removing a single spade full of soil, a team member placed the detector in the ground and covered it with a plastic drinking cup to bias the sample against dilution by the atmosphere, which is extremely low in radon. Soil was tightly packed around the cup.
Team members took photographs of each detector placement as the mobile GIS was used to collect the GPS location coordinates. They used the camera to scan the detector serial number bar codes through the lens. This recorded the detector serial numbers directly to the photograph metadata headers. Minimal handwritten notes were recorded during deployment. Each two-person team completed between four and six array deployments (placing 36 to 54 detectors) on an average day. Because actual deployments were quickly accomplished, most of the time was spent traversing terrain.
Crews typically draped ribbons or other markers on the surrounding vegetation so the detector placements would be easy to find during the pickup phase. Most detectors were retrieved about two weeks later and rescanned if the original GPS fix had been corrupted due to satellite geometry, weather, or another issue. Roughly 10 percent of the detectors had been disturbed in some way during exposure, usually by livestock or hunters. The placement and pickup deployment and recovery were completed over the course of approximately six weeks in the field. The geosciences firm shipped the detectors to the manufacturer's laboratory in Illinois for etching and automated counting of the alpha tracks.
Mapping the Results
After completing each day's fieldwork, the teams returned to base camp where the SD cards from the cameras were plugged into the desktop computer running ArcView and the GPS-Photo Link photomapping package. Launched inside the GIS, GPS-Photo Link correlated each photograph with its correct GPS coordinates and bar code number and generated a shapefile with attributes.
 |
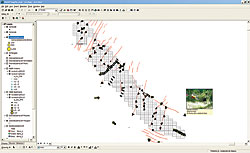
| This claims map shows lineaments and detector locations. GPS-Photo Link, an ArcView plug-in, displays a pop-up window when the cursor rolls over a detector location. Clicking the location brings up a larger image with additional image metadata. |
The software used the GPS data to georeference each photo precisely in the GIS data layers. The photomapping software created icons for every photo location and posted them in the GIS. Spurious GPS fixes could be identified and rescans planned. At this time, the senior scientist was able to address questions from the technicians regarding specific deployments.
For each sensor, the laboratory delivered the detector readings in Excel spreadsheets containing the serial number and corresponding radon concentration level expressed in picocuries per liter (pCi/l). The Excel file was loaded into ArcView, and the radon gas values were linked by serial number to the appropriate shapefile. A technician could simply click on the photo icon on the GIS layer to view the radon reading and photographs for any specific detector location.
The beauty of the photomapping technique in this phase of the project was the simple and nearly foolproof way the camera served as a digital organizer that permanently linked the detector photo with its serial number and GPS points and ultimately radon concentration data. There was virtually no way to mix up the information collected in the field. Once the radon readings were received, mapping the results was easy.
Prior to creating a map to represent the radon concentrations across the project area, the geoscientists established a lower radon level cutoff representing atmospheric contamination that eliminated those values from analysis. They then processed the remaining samples and used kriging methods to map expected values of soil radon. As anticipated by the barometric-pumping model, several high-concentration radon zones were mapped despite the fact that soil geochemistry is generally quite uniform across the area. This indicates a transport of radon is occurring from beneath the soil zone. Further studies are being conducted prior to drilling to determine how the anomalous areas relate to the likely presence of uranium.
Evaluating GPS Photomapping
The GPS photomapping technique proved a valuable tool both during the fieldwork and later during analysis. In the field, crews could move more quickly from one detector site to another because the camera saved them valuable time by instantly recording the bar code number and capturing a photographic description of the scene.
More important, there was no need to spend time transcribing numerical data from several sources at the end of the day. In addition, the occasional bad GPS fix was immediately recognized and the site scheduled for a rescan. These rescans, however, were often unnecessary due to consistent use of the nine detector arrays. A single bad fix could be reconstructed to acceptable accuracy thanks to the high accuracy of the valid locations.
The greatest enhancement in fieldwork efficiency was realized later during analysis of the radon detector readings. Every scientist and researcher has experienced a situation in which they return from the field and begin examining their data only to discover there was another piece of information they should have collected but hadn't because, at the time, they had not realized the value of a particular observation or specimen. In many cases, a trip back to the field is impossible due to distance, time, or monetary constraints.
This could have been the case with the radon gas mapping project, but it wasn't. When the gas reading results were returned to GeoLogic for analysis, geoscientists noticed instances of anomalous radon values at detectors positioned just a meter from other detectors with more normal readings. To explore the origins of these expected geostatistical variations, the scientists viewed the photos of those detectors and assessed whether differences in soil moisture, compaction, or composition may have influenced the readings. This is a luxury seldom afforded to analysts of large field datasets.
The richness of visual detail in the photographs, along with the fact that the images are digitally linked with their attributes and locations, confirmed the viability of GPS photomapping as a valuable complement to traditional fieldwork. GeoLogic plans to continue using the technique to capture GPS-stamped photographs as visual records of outcrops, formations, and rock samples that will be mapped and analyzed in the interpretation in the next phase of uranium exploration at the Colorado site and in several new projects.
About the Authors
Rick Bobbitt is the president of GeoSpatial Experts in Thornton, Colorado. He has a bachelor's degree in computer science and 20 years of experience programming GPS/GIS applications. He worked for several navigation and GIS companies, including Bendix/King and II Morrow Inc., developing avionics software for small airplanes. Bobbitt founded GeoSpatial Experts in 2001 while developing applications for GPS-enabled digital cameras. Later that year he released GPS-Photo Link software to link GPS information to any digital camera. In 2004, GeoSpatial Experts began reselling the Ricoh Pro G3 GPS-enabled digital camera along with its new Ricoh edition of the GPS-Photo Link software featuring an ArcGIS plug-in.
Cady Johnson is the principal of GeoLogic VR, LLC, an Arizona company specializing in exploration, monitoring, and visualization services. Previous employers include Bendix Field Engineering Corp.; Woodward-Clyde Federal Services; and Petroleum Helicopters, Inc. He holds a doctorate in geology and hydrology/hydrogeology from the University of Nevada, Reno, and an airline transport pilot rating in helicopters. Current projects include regional water supply investigations in the United States and Paraguay, litigation support related to open pit mining effects on groundwater, development of virtual-reality models based on airborne oblique image sets, and uranium exploration.
|