|
The Magazine for
Esri Software Users |
|
|||
Students Produce GIS Databases
| ||||||||||
| ||||
Case Study: The Atlanta Environmental Project
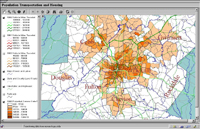
The Atlanta Environmental Monitoring GIS Project developed a database containing both temporal and spatial data on pollution in the metropolitan Atlanta area. This database, containing data for an 18-year period, was created as a tool to study the effects of pollution levels on population movement and property values.
Two geography graduate students and three undergraduates enrolled in the Advanced GIS class developed that database which contains data on water and air pollutants, toxic release and hazardous sites, and traffic counts for major highways in the 10-county metropolitan Atlanta area. Demographic data, such as population density and median household value,was included so that comparisons could be made between cultural and environmental change.
A basemap, showing major roads, railroads, county boundaries, hydrography, elevation, and land use/land cover data for this area, was added to assist in analysis. All data was clipped to the 10-county metropolitan area boundary. The project generated paper maps, four interactive online maps, and a CD–ROM containing a more extensive data set.
The project involved working with data in several file formats including ArcInfo export format, Esri shapefile format, raster data in ARC GRID format, USGS digital elevation model (DEM) data in Spatial Data Transfer Standard (SDTS) format, LANDSAT Thematic Mapper imagery, and attribute data in dBASE and Microsoft Access table files, as well as many other spatial and attribute file formats.
Digital data was collected from a variety of sources including:
- Georgia GIS Clearinghouse, a node of the National Spatial Data Infrastructure
- United States Environmental Protection Agency
- Centers for Disease Control and Prevention
- Georgia Department of Transportation
- United States Bureau of the Census
Detailed information on the data sources used in these projects is available from the Department of Anthropology and Geography Web site. Some attribute data required cleanup, manipulation, and reclassification. All spatial data had to be reprojected into a standard coordinate system. All digital data sets were documented using FGDC compliant metadata.
Layouts were created for three different views-air pollution, water pollution, and demographics. The final step was making the introductory Web pages and serving the interactive maps using ArcView IMS. All processes and procedures were documented in a final report that accompanies the paper maps, Web pages, and CD–ROM.
| ||||
Case Study: The Cairo Project
Another project, still in progress, required a diverse set of cartographic skills. Students working on this project are creating data for a study that focuses on changes in development and land use patterns over time on Zamalek, an Egyptian island located in the Nile River near downtown Cairo.
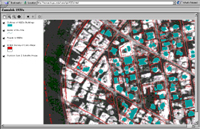
The project involves compiling, overlaying, and comparing three data sets from three different sources-paper maps, satellite imagery, and field notes. The paper maps were produced by British surveyors in the 1920s and photographed onto microfilm in small grid sections. A SPIN-2 satellite image of Cairo from the early 1990s was also used. Field notes, compiled by Dr. Dona Stewart in 1999, were also incorporated by attaching them to a set of polygons that were digitized from the SPIN-2 image.
[SPIN-2 images are panchromatic two-meter resolution Russian satellite image data that has been digitized and orthorectified.]
Extensive image processing work was required to bring the paper maps into the GIS database so that they could be compared with the satellite imagery. Some of the processes performed are listed below.
- The microfilm images of the paper maps were scanned into Adobe Photoshop at a high resolution (2,000 dpi).
- The scanned images were matched, aligned, and joined or fitted together manually to form a complete map coverage. These images were transformed to compensate for distortions and minute differences in scale.
- Scanned images were cleaned up by removing extraneous information and marginal data.
- Variations in tonal range present in the original maps or resulting from lighting vagaries introduced during the photographing were corrected.
- Cartographic improvements to legends and feature names were made on the resulting large map.
The final cleaned and enhanced image was saved in TIFF format and then brought into ArcView GIS for further processing. The digital versions of the British maps were georeferenced to the same projection, grid system, and datum as the SPIN-2 image. A polygon layer showing the footprints of significant buildings visible in the SPIN-2 image was digitized on-screen in ArcView GIS, and the field notes were added as attribute tables to the polygon layer.
The final step was serving these themes on the Internet using ArcView IMS and generating a color-enhanced paper map using Adobe Photoshop. Database compilation is still in progress. When this work is completed, Dr. Stewart will analyze the changes in land use patterns that have taken place on Zamalek.
Problems and Challenges
Anyone who has compiled a GIS database knows that the process can be extremely time-consuming, labor-intensive, and often frustrating. The first challenge for most students was locating suitable, workable data. The search for suitable data sometimes led to a dead end. Other times, data sources that initially seemed appropriate were inadequately documented.
These experiences gave students a real appreciation of the value of good metadata. Finding an appropriate, well-documented data set was often a cause for celebration. Building a database from many divergent sources taught students not to use a simple cookbook approach to data conversion. Because data sets are unique, it is critical to be flexible and figure out the quirks of individual data sets. Help menus are invaluable in this quest.
An additional challenge for students involved in these projects was transforming the data layers into a consistent projection, grid system, and datum. While students were expected to have previously completed coursework relating to these vitally important cartographic concepts, they had to correctly apply this knowledge to complete the project. Building the GIS databases and serving them on the Web has benefited not only the students who participated but also other students, faculty, and visitors to the Web site who can now access this data.
Conclusion
Students in the advanced GIS class and the two graduate research assistants, guided by faculty members where necessary, performed all the work on these projects. This innovative approach gave these students a unique opportunity to acquire skills that are not readily obtainable in any other manner in an academic setting. Overall response to this approach by students, faculty, and staff has been favorable so far.
In the three semesters since the program started, students in Advanced GIS classes have worked on four major projects. In addition to the Atlanta Environmental and Cairo projects, a set of business-related maps of the Atlanta Metropolitan Statistical Area and a group of maps containing physical and demographic data for the State of Georgia have been created.
Based on current enrollment figures, these GIS databases will potentially impact 750 students annually. From January through March of 2000, approximately 1,400 visits were made to the site by 600 visitors. Of the 600 visitors, 220 were new visitors. These visits to the Web site have been received from all over the world including Canada, Australia, Japan, United Kingdom, South Africa, Austria, Singapore, Germany, and the Netherlands.
This innovative GIS program prepares students for developing and using real-world GIS applications and helps faculty, students not enrolled in the GIS program, and the larger community.
Resources
For more information, contact
Zhi-Yong Yin, Ph.D.
Department of Anthropology and Geography
Georgia State University
33 Gilmer Street
University Plaza
Atlanta, Georgia 30303-3083
Tel.: 404-651-3232
Fax: 404-651-32351
E-mail: gegzyy@panther.gsu.edu
or
Paul A. DiGirolamo
Tel.: 404-373-5884
E-mail: paul_d@mindspring.com