Waterlogged Area Analysis with ArcInfo

| Waterlogged Area Analysis with ArcInfo | |
|
Editor's note: Excessive irrigation in areas with poor drainage causes waterlogging and salinization of the soil. When water does not penetrate deeply, it raises the water table. Air spaces in the soil are filled with water, and plant roots suffocate. Consequently, waterlogged conditions adversely affect crop yields.
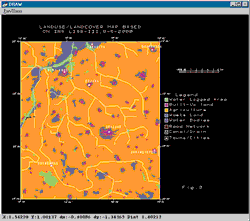
India's ambitious plans for developing irrigation are essential-the nation must increase and stabilize crop production. In 2001, the Indian Ministry of Water Resources estimated the usable surface water for the country at 69.0 million hectacre meters (m ha m) and groundwater at 43.2 m ha m per year. In India, groundwater supplies more than 45 percent of the total water for irrigation. Between 20,000 and 30,000 ha of irrigated land are lost each year due to waterlogging and salinization. The total acreage being irrigated has increased rapidly. However, in the planning stages, inadequate attention has been paid to the drainage characteristics of new areas. This is partly due to a lack of data and lack of resources to process the data. Over the years, waterlogging problems have developed, in varying degrees, in different parts of the country. Infrastructure, such as roads, railways, and canals, has also added substantially to the problem by cutting across the natural drainage lines. Water resources management and agricultural development require a multidisciplinary approach that integrates analysis of spatial and nonspatial data parameters so that decision makers can implement plans for water use in problematic areas. In the Jhajjar district of Haryana State, waterlogged areas are being mapped and analyzed. This study, covering 677 km2, demonstrates the benefits of using ArcInfo to automate, manipulate, analyze, and display geographic data for the district. Satellite data gathered on May 9, 2000, from the Indian Remote Sensing (IRS) Linear Imaging and Self scanning Sensor (LISS III) and provided in False Colour Composite (FCC) prints was interpreted for the identification of water bodies, land use, land cover classes, and waterlogged areas.
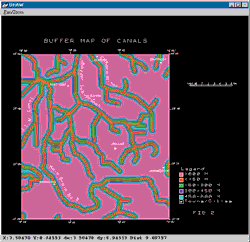
Satellite-based information was digitized and overlaid on the infrastructure network of canals, roads, and villages that had been digitized from Survey of India topographic sheets at 1:50,000 scale. The infrastructure network was economically updated using the satellite data. Datasets on the depth to the groundwater table, rainfall, water depth, soils, and geomorphology (slope) were also collected and digitized in ArcInfo. Most canals in this area are unlined and cause severe seepage problems. A buffer map of the canal network was generated in ArcInfo. Five different classes were created, based on distance from the canal, ranging from within 150 meters (m) to 600 m away. The buffer map identifies areas nearest to canals and therefore most prone to waterlogging. Other parameters for identifying areas prone to waterlogging included type of land use, soil geomorphology, groundwater depth, and rainfall in addition to canal proximity. These factors were weighted on a scale between one and five and integrated in GIS. Weights were based on Saaty's AHP Importance Scale and the consensus of expert opinion and existing studies. [Thomas Saaty developed the analytic hierarchy process (AHP), an approach to multicriteria decision making.] An ARC Macro Language (AML) script integrated the thematic maps based on criteria defined for all six parameters. The composite map, derived using this AML, which regrouped 9,100 polygons, showed four significant waterlogging-prone zones. Areas prone to waterlogging were categorized as shown in Table 1.
The interpreted land use/land cover map created from IRS imagery was overlaid on the waterlogging area map. The waterlogged areas were analyzed to find their relationship to hydrological and terrain characteristics. The LINEST command in Microsoft Excel was used to assess the sequence of influential parameters that cause waterlogged conditions. [LINEST calculates the statistics for a line by the least squares method and then calculates the straight line that best fits the data and returns an array that describes the line.] The descending order of the sequence of the influential parameters for water logging was determined. These factors are proximity to a canal; groundwater, soils, rainfall, land use, and land cover; and geomorphology. ArcInfo was an effective tool for integrating and analyzing waterlogged areas. The results of this study can be used to prioritize areas for reclamation of waterlogged land. For more information on the above project, contact About the Authors Mr. M. Sai Sudarsanam is a member of the Institution of Engineers (Civil) and obtained a master's degree in hydrology from the University of Roorkee. He joined the MBTS Govt. Polytechnic, Guntur, Andhra Pradesh, India, as a Lecturer in Civil Engineering (L.C.E.) in 1981. He is an assistant engineer at the Central Water Commission, Upper Krishna Sub Division, Miraj, India. Dr. Ranvir Singh received a master's degree in soil water conservation engineering from the Indian Institute of Technology, Kharagpur in India and a doctorate in water resources systems engineering from the Indian Institute of Technology, Delhi in India. He is a professor at the University of Roorkee and the head of the department of hydrology. Dr. P.K. Garg holds bachelor's and master's degrees in civil engineering from the University of Roorkee and a doctorate from the University of Bristol in the United Kingdom. He did postdoctoral work at the University of Reading, also in the United Kingdom. His areas of research specializations are remote sensing, GIS, and digital terrain modeling. He has authored numerous research papers, written one textbook on remote sensing and GIS, and completed seven major research projects. Dr. Garg is an associate professor in the department of civil engineering and is the coordinator of the remote sensing section at the University of Roorkee. He is also the coordinator of the Centre for Remote Sensing at the University of Roorkee, a center of excellence funded by the Ministry of Human Resource Development (MHRD) and the All India Council for Technical Education (AICTE). References Garg, P.K., and Agarwal, C.S., Text Book on Remote Sensing in Natural Resources Monitoring and Management. Wheeler Publishing House, New Delhi, India, 2000. Government of India, Ministry of Water Resources, Report of the Working Group on Problem Identification in Irrigated Areas with Suggested Remedial Measures. Ministry of Water Resources, New Delhi, India, 1991. United Nations, Environment and Natural Resources Management Division, Manual on GIS for Planners and Decision Makers-Report No. STESCAP/1615. ESCAP. Regional Space Applications Programme, Bangkok, Thailand, 1996. |