Stand Up Straight—Ortho Perspective on Downtown Denver
Lisa Haskell and Rob O'Donnell, Sanborn Colorado, L.L.C.

| Stand Up Straight—Ortho Perspective on Downtown Denver Lisa Haskell and Rob O'Donnell, Sanborn Colorado, L.L.C. | |
|
Digital orthophotography is a resource being utilized by a significant portion of GIS users. It has become a popular base layer in modern GIS. With the price of disk space dropping and the speed of computers increasing, digital orthophotos are a viable option for building a fully developed GIS. Digital orthophotos can be used for technically specific needs such as planimetric or cadastral mapping; utility data capture and quality control; and accurate project analysis and design implementations. Digital orthophotos can also be used to explain projects and issues to the general public because real-world pictures are easier for the untrained eye to understand. They contain landmarks and recognizable places. For example, digital imagery can help an audience visualize the new light rail corridor by showing existing conditions. Proposed changes can be overlaid as vector information. The world is constantly changing, and digital orthophotography can help monitor change. What Is a Digital Orthophoto? "Digital orthophoto: A raster photographic image that is combined with differential rectification to remove image displacements caused by camera tilt and terrain relief."
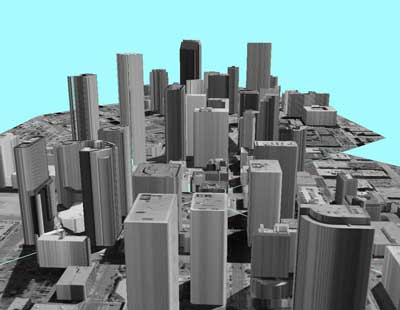
A digital orthophoto is simply a photographic map that can be used to measure true distances. It is an accurate representation of the earth's surface. To create a digital orthophoto, several key input files are necessary: aerial photos with a high-percentage overlap, scanned imagery, aerotriangulation (A.T.) results, and a digital elevation model (DEM). Scanned imagery can be obtained from scanning aerial photo diapositives or negatives on an image-quality scanner. The A.T. results include a camera calibration report and the ground control. At a minimum, the DEM can be a regularly spaced grid of masspoints, each containing an x, y, and z value. A more robust digital terrain model (DTM) can also be used because it includes strategically placed masspoints, dense breaklines, and ridgelines. Limitations of Ordinary Digital Orthophotos Expansion features, such as bridges, create problems in ordinary digital orthophotos. DTM data is captured at ground level, so bridges that are rectified with this data are "pulled down to the ground," giving them a distorted appearance. Elevated features (e.g., buildings, trees, power lines) also create a problem due to radial displacement. Distortion increases with the distance from the center of the aerial photograph-features, such as buildings, lean noticeably. The amount a feature leans depends on the percentage of overlap in the aerial photography and the height of that feature. The higher percentage of overlap in the aerial photography used, the less features will lean because the amount of photography used from the outer edge is reduced. This distortion can have an impact on the functional and aesthetic features of a digital orthophoto. True Ortho Imagery The True Ortho method, developed by Sanborn Colorado, L.L.C., produces imagery that is rectified without building lean. Surrounding streets and other cultural features, ordinarily not visible in standard orthophotos, are clearly shown. This innovative process, using sophisticated production software and procedures, is called Method for the Elimination of Terrain and Relief Displacement in Orthophotography (METRO). With this method, more cadastral information can be captured from digital orthophoto imagery. The METRO system uses stereometrically derived DTMs to fully rectify aerial images. DTMs are processed into triangulated irregular networks (TINs) to provide a more accurate representation of the terrain surface. This method reduces errors caused by interpolation from a regular grid of masspoints. TINs eliminate the waviness around sharp terrain breaks such as steep embankments, road edges, railway grades, and hydrographic features. This process straightens bridges and buildings in images. It requires the collection of DTM data for bridges and buildings as well as for the ground below these features. Bridges and buildings are captured as separate polygons with true elevations, while the ground below each is also modeled. When the scanned image is rectified, both the bridge and the ground below will be accurately represented. The most impressive and useful component of the METRO process is its ability to make buildings "stand up straight" so that all the information can be captured by the digital orthophoto. It involves collecting detailed data describing the tops of buildings. Compilers must photogrammetrically capture and model every building at roof level and every feature that rises more than 10 feet from a rooftop (e.g., vents, elevator shafts, turrets, slopes, and other changes in elevation). The highest point of each enclosed feature is also captured. Compilers must also capture any outstanding features at ground level such as stairwells or courtyards that are part of the building. This data also includes the standard ground DTM capture. This raw, yet highly detailed, data can be used by ArcView 3.x with the ArcView 3D Analyst extension to provide a three-dimensional view that can be scaled, rotated, and expanded and that is useful for city planning, developing, and marketing.
Once compilation of the planimetric features is complete, the digital orthophoto technician edits the DTM data. The technician builds two offset polygons from the original building polygon. The inner polygon will have the elevation of the rooftop taken from the captured roof spot. The outer polygon will have the elevation of the ground taken from the captured building. After building the offset polygons, the original polygon is discarded. This data is used to automatically place building-top imagery directly over the footprint of the building. Corresponding pieces of images available from the increased overlap are used to fill the imagery holes left after the building lean is corrected. When aerial photography is created, the amount of overlap and sidelap of the flight lines is very important. Ideally, the project area should be flown with an 80 percent overlap and 60 percent sidelap. A decrease in either of these values will eliminate the imagery that is inserted to compensate for the distortion of buildings in the original image. The result will be a blank area where the camera could not see the ground. An Example: The City of Denver The METRO system was used in the City and County of Denver Orthophotography Project—2000. The project area encompassed approximately 120 square miles-the entire geographic extent of the City of Denver, Colorado. Imagery was flown at a scale of 1 inch = 600 feet to produce 0.5-foot pixel resolution. The entire project was flown with 60 percent overlap and 30 percent sidelap coverage. Downtown Denver, the area to which the True Ortho method would be applied, was flown with 80 percent overlap and 60 percent sidelap coverage. The downtown area, a third of a square mile, is full of tall buildings that form a narrow corridor. Without True Ortho building correction, many features-intersections, manholes, utility poles, parking meters, streetlights, and alleyways-would have been hidden from view, and it would be difficult to perform any type of GIS analysis or interpretation using this imagery. The corrected images can be used to perform analysis, compilation work, or image interpretation. The METRO process produces a highly interpretable image. This process is more labor-intensive than the standard DEM collection. The compiler spends a fair amount of time capturing features on rooftops and adding in slopes and label points. The digital orthophoto technician spends additional time editing the buildings in the DTM to produce the desired results. Although this additional labor increases the cost of the project, it should pay off in the long run. For clients who perform capture or compilation of planimetric and/or utility features, the benefits are numerous. These features can be discerned directly from the digital orthophotos. The user will not need to consult contact prints for hidden features.
Conclusion The METRO process, created by Sanborn Colorado, L.L.C., takes the lean out of tall buildings in digital orthophotography. This results in an image that is free of radial displacement. The process, although somewhat labor-intensive, provides benefits worth the effort. The end user can capture all features present in the image including the ones hidden behind leaning buildings. The end product can be useful for data capture, quality control, analysis, display, and marketing. The digital orthophotos can be further overlaid with the digital building model and digital terrain model to create an amazing presentation. Without the True Ortho method and extensive modeling, the overlay of the orthophoto to produce a high-quality presentation map or fly-through would not be possible. About the Authors Lisa M. Haskell worked as a technician and a project coordinator in digital orthophotography department at the Sanborn Colorado, L.L.C., for six years. While in this department she worked on special projects that included imagery of the Oklahoma City bombing area, Denver, San Diego, and Ireland. Since moving to the technical services department at Sanborn, she has been working on client applications, and developing in-house production specs and plotting routines in ArcInfo. She holds a master's degree in geography from Oklahoma State University and a bachelor's degree in geography from Northwest Missouri State University. Rob O'Donnell has worked at Sanborn Colorado, L.L.C., for more than five years. During that time he held positions as a technician, project coordinator, and GIS analyst. He currently works as a GIS programmer analyst and specializes in Esri products. He is responsible for ArcInfo database designs and object models, research and development, geodatabase conversion, and system integration using SQLServer, ArcSDE, ArcInfo, Oracle, and ArcInfo training. He received a bachelor's degree in geography from California State University at Chico and is enrolled in a masters program at University of Colorado at Colorado Springs. Acknowledgments The authors thank the project administrators at the City and County of Denver for granting permission to use and display their data. Special thanks to David Luhan, GIS data administrator and project manager for the City of Denver, for his support throughout the duration of this project. The authors also acknowledge the hard work of the Sanborn Colorado, L.L.C., stereo-compilers and technicians who worked on the initial project to make it a quality product. Special thanks go to Jenny Madsen and Chris Russelavage for their efforts in organizing and preparing much of the archived data used. For more information, contact |