October - December 2003
October - December 2003 |
||||||||
|
|
||||||||
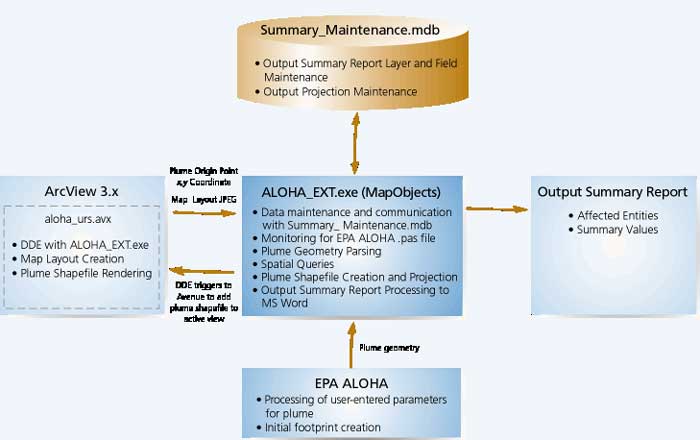
Chemical storage facilities located near population centers have long posed both a security and an emergency response challenge for government agencies. An accidental release of chemicals from a storage facility or a chemical transportation vehicle would require nearby municipal agencies to track the chemical's gas cloud or "plume" in order to determine its potential impact on nearby population centers. In light of the events of September 11, 2001, the possibility of an intentional release, with potentially high impact, must also be considered. This article discusses a pilot application developed jointly by Erie County and Esri business partner URS Corporation's Buffalo, New York, office. This pilot application integrates the Environmental Protection Agency (EPA) Aerial Locations of Hazardous Atmospheres (ALOHA) program with MapObjects and ArcView technologies to provide rapid, real-time modeling and reporting for chemical plumes and the areas that they affect. Erie County is located in western New York State. Its population is 950,265 (Census 2000) within a land area of 1,044 square miles. The county's largest city and county seat is Buffalo. EPA Aerial Locations of Hazardous Atmospheres ProgramALOHA is a program developed by the EPA Chemical Emergency Preparedness and Prevention Office (CEPPO) and the National Oceanic and Atmospheric Administration (NOAA) Office of Response and Restoration and is part of the agency's Computer-Aided Management of Emergency Operations (CAMEO) suite. It is available without cost. ALOHA contains a database of approximately 1,000 common chemicals. Using information from this database, including chemical type, accident location (urban or rural), weather conditions (temperature, wind speed, and wind direction), and accident parameters (storage medium, size of opening, pressure of storage medium), ALOHA can predict the atmospheric dispersion rate and direction of vapors from a broken pipe, tank, or other source. ALOHA can also generate a visual representation of the plume created by the chemical release. ALOHA, designed as a lightweight emergency response tool and training aid, is relatively easy to use and integrates well with the CAMEO suite; the original CAMEO applications; and MARPLOT, a mapping application. ALOHA's limitations include reduced prediction capability at low wind speeds, with variable wind direction, or under highly unstable atmospheric conditions. ALOHA cannot incorporate chemical solutions, particulates, chemical reactions, or the results of fires into its modeling processes. Designing an Integrated ApplicationPrior to requesting assistance of URS, the Erie County GIS Division had experimented with an ArcView extension that converted and imported ALOHA plume geometry into ArcView 3. Use of the ArcView extension, however, required the operator to have some basic GIS experience. Moreover, the shapefile created by the extension could be created only in a decimal degrees coordinate system. Finally, the extension offered no analytical capabilities for determining which entities would be affected by the plume. The county therefore began looking for a system that
The solution developed by Erie County and URS Corporation made use of several technologies that provided for future application enhancements and portability. Although planning to migrate to the ArcGIS platform by the end of the year, the county needed the application to work with its existing ArcView 3 technology. The core engine of the program developed for use with ArcView 3 is a MapObjects-based executable. MapObjects was chosen for its stand-alone capability and its better portability to the COM-based ArcGIS architecture. Minimal source code authoring was invested in Avenue. Configuring Output Summary Data Sources and ProjectionsA key benefit of the application is that it allows county GIS administrators to configure the application to present features from spatial data sources that emergency response decision makers would want to see in the event of an emergency. Examples of these data sources include schools, medical facilities, shelters, police and fire stations, and senior housing. The Output Summary Report (OSR) created by the application was developed to provide maximum flexibility in reporting. An administrator of the application can determine which shapefiles will be overlaid against the plume shapefile. In turn, specific attribute fields in a selected shapefile can be selected for inclusion in the OSR. If an attribute field contains numeric values, these can be summarized in the Executive Summary report. The order in which shapefiles are presented in the report can also be set in addition to the order of display for selected attribute fields from a shapefile. County GIS administrators can also set the projection into which the plume will be projected after it has been imported into ArcView. For Erie County, this would typically be New York State Plane West North American Datum of 1983 (NAD 83), but options are also available for New York State Plane West NAD 27 and Universal Transverse Mercator (UTM) coordinate systems. Continued on page 2 |