October - December 2003
October - December 2003 |
||||||||
|
|
||||||||
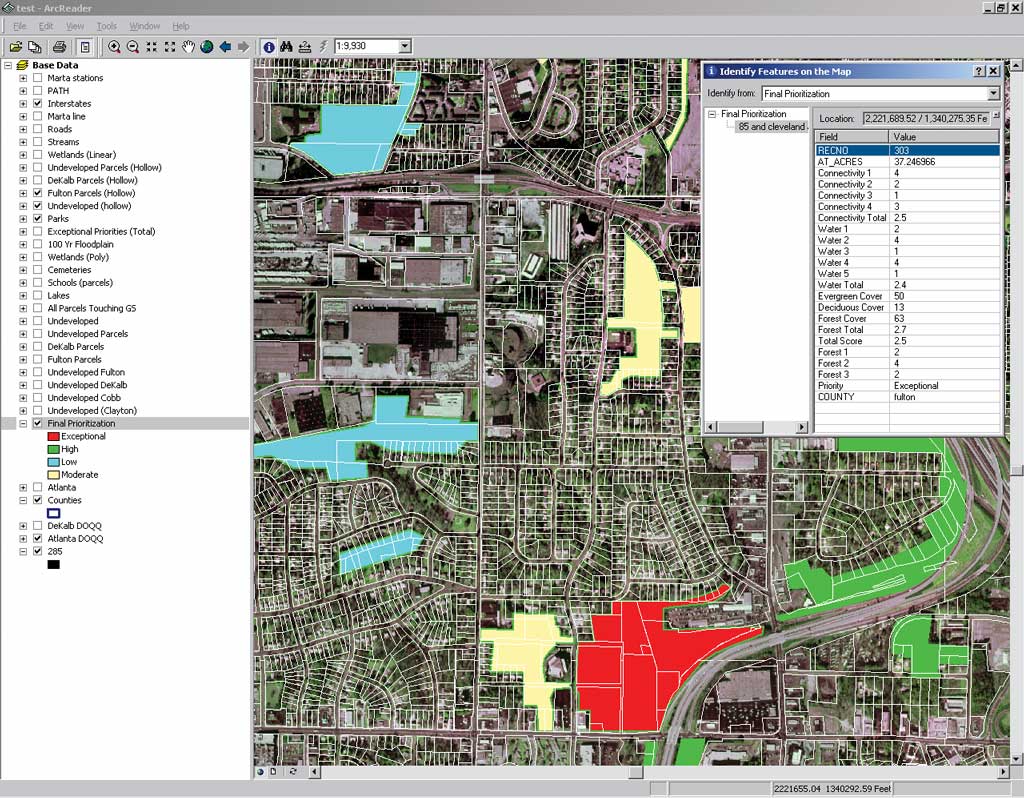
A summary function produces cross-tabulation statistics that compare class value areas between two thematic files including number of points in common, number of acres (or hectares or square miles) in common, and percentages. The supervised classification of the Atlanta image and the potential greenspace layer resulted in the formation of eight classes: evergreen, deciduous, hardwoods, shrub, grasses, water, exposed earth, and shadow. Of the eight classes, evergreen and deciduous forest were the most relevant. The classified images were mosaicked and overlaid with the potential greenspace layer, and a summary function was performed that broke down image classes by their associated polygons in the greenspace layer. This information was placed in a spreadsheet and used to calculate various classification statistics for each potential greenspace polygon. The spreadsheet was then joined back to the potential greenspace shapefile so results could be viewed graphically. Results of the forestry analysis were used to rank potential greenspace polygons based on amount and type of forest cover. After prioritizing the polygons, a new GIS layer was created by intersecting the potential greenspace layer with parcel data joined to tax assessor information. The intersect layer allowed CGIS to do three things.
Project ResultsPhase I identified 379 potential greenspace areas that comprised more than 12,000 parcels inside the city of Atlanta, ranging in size from 5 to 512 acres. These areas totaled more than 14,000 acres and had an appraised value of more than a half billion dollars. Located primarily along stream corridors, these potential greenspace areas represent approximately 16.6 percent of the city's total area. Currently, the city's parks make up only about 3.5 percent of the city's area. Phase II identified 756 potential greenspace areas consisting of more than 23,000 parcels inside the perimeter demarcated by Interstate 285. These areas ranged in size from 5 acres to 376 acres, totaled almost 20,000 acres, and had an appraised value of almost $1.5 billion. Although these potential greenspace areas were also found primarily along stream corridors, large residential backyards also constituted a sizable portion of the potential greenspace in certain parts of the study area. In this study area, potential greenspace represents approximately 12.5 percent of the total area while existing Metro Atlanta parks comprise approximately 10 percent. The potential greenspace parcels and their associated tax and ownership information generated by Phase I and Phase II were ranked and prioritized by impact on water quality, forestry resources, and greenspace system connectivity and stored in a Microsoft Access database. This database has unique identifiers for parcels and potential greenspace polygons that allow tables to be joined to either GIS dataset to view the results spatially and create thematic maps for displaying information such as the number of parcels per potential greenspace polygon or the appraised value of potential greenspace. Disseminating InformationWhile the results of the Greenspace Acquisition Support System are useful to several local agencies, many of these agencies do not have the necessary GIS capabilities or expertise to interpret them. To address this dilemma, the CGIS created The Interactive Mapper, an HTML-based program, as part of Phase I. This program allows users to view identified potential greenspaces, greenspace analyses rankings, and prioritization scores as well as print maps, view ranking and prioritization criteria, and inspect tables containing potential greenspace analyses scores. Because this program is relatively small (15 MB), it can be published over the Internet or viewed locally on any computer with a Web browser. As part of Phase II, the CGIS employed ArcReader in conjunction with published map files (PMFs) created using the ArcGIS ArcPublisher extension. This allowed CGIS to deliver all GIS data and results, including aerial imagery, in a format that gave users improved access to maps and potential greenspace information and the ability to query and print maps. The CGIS provided information on using ArcReader to Trees Atlanta and other local agencies, which lets them use study results for targeting land for acquisition. The CGIS delivered the GIS data and PMFs to Trees Atlanta and other local agencies on a single CD-ROM. Project StatusCGIS completed Phases I and II of the Greenspace Acquisition Support System in 2001 and 2003, respectively. The results of these two phases are currently being used by DeKalb County, Trees Atlanta, and The Trust for Public Land. According to Kevin Johnson, project manager with The Trust for Public Land, having a GIS-based comprehensive inventory of Atlanta's remaining greenspaces in a convenient format "has proven to be a great supplement to our current greenspace preservation efforts by solidifying the importance of our current acquisitions as well as providing us with future targets for greenspace preservation. It has also made us more aware of the necessity to act quickly." The Greenspace Acquisition Support System is a model for other Georgia counties and municipalities. It demonstrates the importance of using GIS for greenspace identification, prioritization, and acquisition. The CGIS intends to focus Phase III efforts in DeKalb County to identify and prioritize lands located outside the perimeter formed by Interstate 285. For more information, contact Tony Giarrusso |