Making More Information Available in Emergencies
GIS Aids Communication, Collaboration, and Coordination
 |
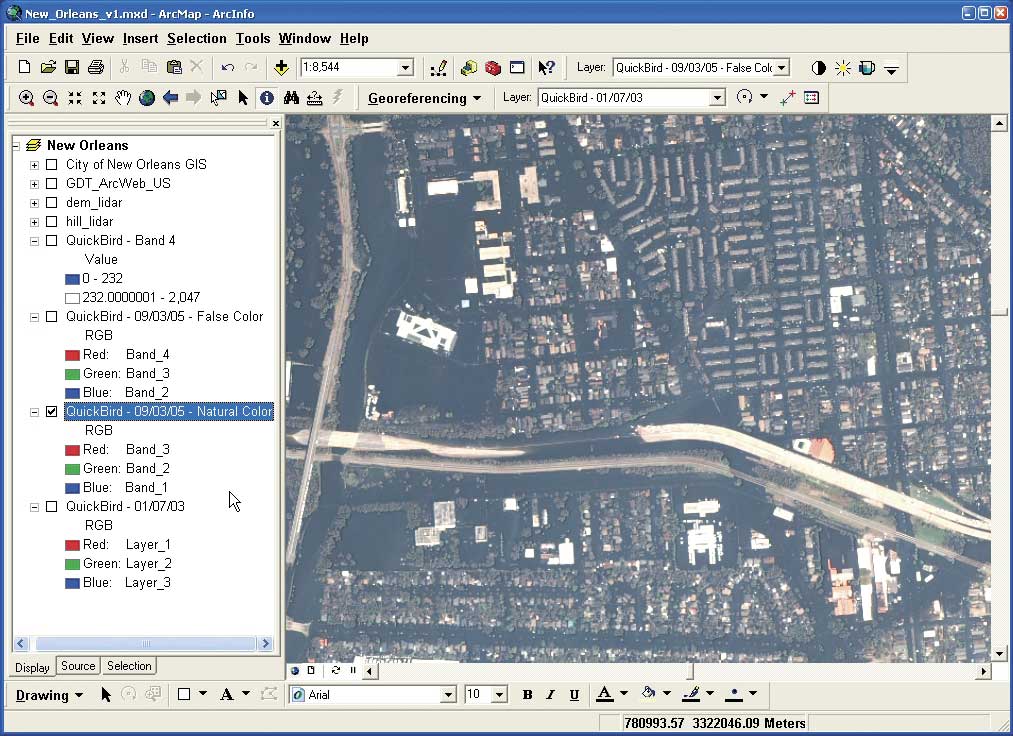
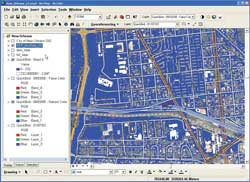
| Distinguishing flooded areas using only a natural-color satellite image is challenging. |
In an increasingly urbanized world, the effects of disasters such as hurricanes and tsunamis are more acutely felt. As coastal areas, in particular, become more densely settled, more people and property are threatened by these events. GIS benefits all aspects of the emergency management cycle from planning, mitigation, and preparedness through response and recovery by integrating complex data in a geographic framework that produces actionable information.
The value of GIS was demonstrated earlier this year when Hurricane Katrina, a Category 5 hurricane, devastated portions of Louisiana, Mississippi, and Alabama. GIS provided a common operational picture or shared vision of the incident that helped organizations and individuals work more effectively.
Even before the hurricane made landfall on August 29, 2005, GIS was helping emergency management personnel and volunteers model its probable effects as described in another article in this section, "Predicting Hurricane Katrina's Storm Surge Using ArcScene." HAZUS-MH, a risk analysis software application that incorporates ArcGIS, was also used to generate wind damage estimates. Understanding where wind and storm surge damage were likely to occur helped managers position resources out of harm's way but near enough to respond quickly.
 |
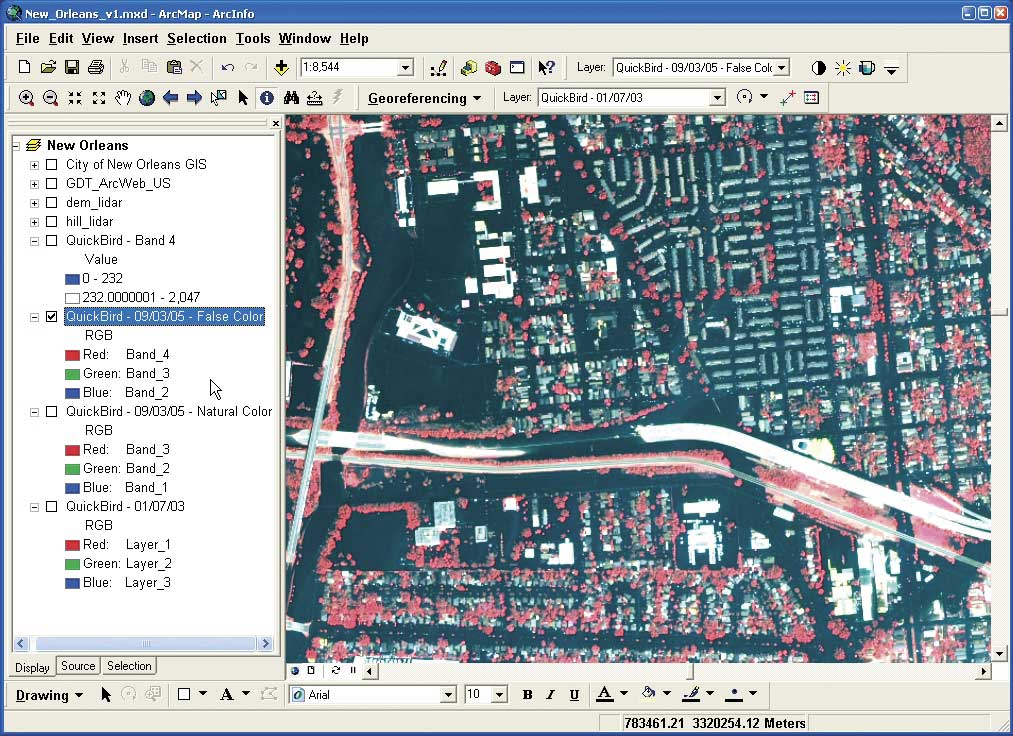
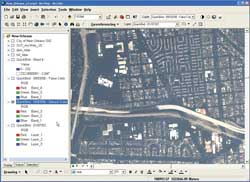
| Using the multispectral DigitalGlobe QuickBird image, it is possible to drop the blue band and change to a false-color image that greatly enhances the clarity. GIS data processing tools take full advantage of the capabilities of the high-resolution satellite camera sensor. |
In response to Hurricane Katrina, Esri actively supported local, state, and federal agencies and private organizations with software, mapping, and analysis services, technical expertise, field GIS, and Web services. The Esri Hurricane Maps and Help Web site was a clearinghouse for GIS resources-people, data, software, and hardware. Organizations and GIS users, regardless of platform, could request assistance from Esri at the site. Those who wanted to offer help could describe the products and services offered. Nearly 100 Esri business partners, Esri corporate alliance partners, hardware vendors, and consultants registered at the site.
The site also directed GIS users who wished to volunteer their GIS skills to the Urban and Regional Information Systems Association (URISA) GISCorps site. This nonprofit organization provides short-term volunteer-based GIS services to underserved communities throughout the world.
 |
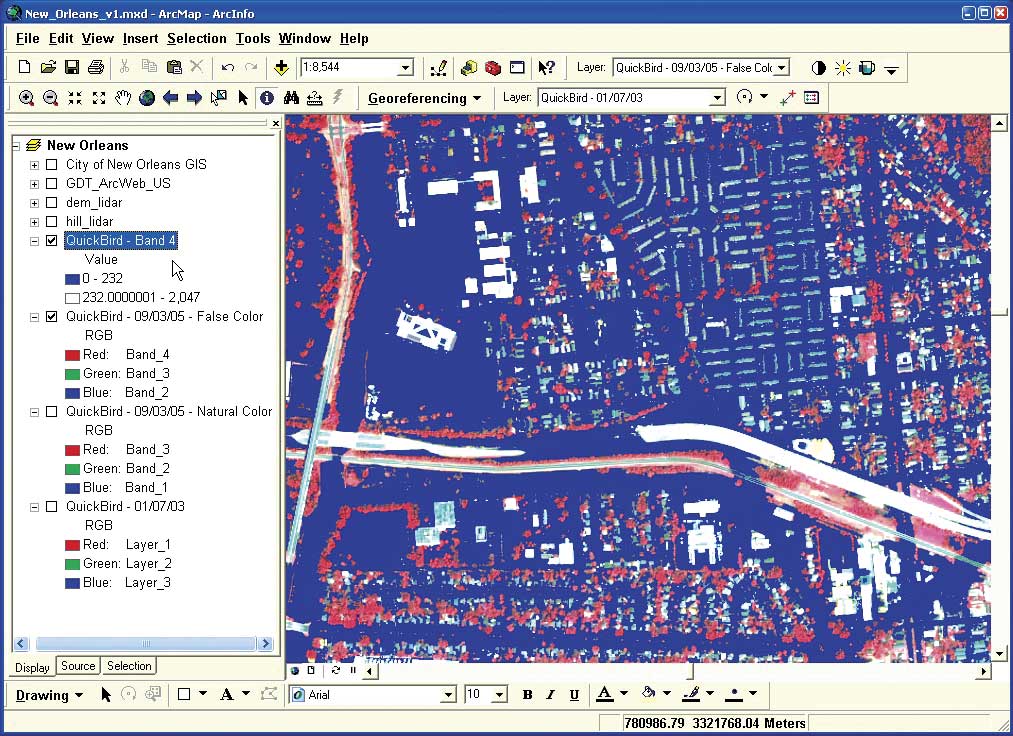
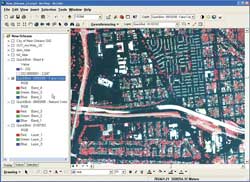
| Using GIS methods, the near infrared band (or all bands) can be quickly classified to create a flooded water mask (shown in blue). |
Several deployments of GISCorps assisted at the Mississippi Emergency Operations Center in Jackson and other locations in the state. In addition to geocoding victim locations, GISCorps volunteers along with volunteers from Mississippi state agencies, the Mississippi University system, and Esri generated a wide range of map products for responders and decision makers. Learn more about the work done by the GISCorps and other volunteers in Mississippi in another article in this issue, "GISCorps Aids Hurricane Response."
GIS-generated maps have become a common part of disaster response activities. However, this event underscored the larger role played by distributed GIS on the Internet. New tools have been developed for this broader GIS Internet environment. Spatial portals help manage, locate, share, and use the geographic knowledge created and maintained by local, state, and federal governments and other organizations. During Hurricane Katrina and Hurricane Rita response efforts, the Geospatial One-Stop (geodata.gov) portal provided central access to data, maps, images, and resources for organizations involved in hurricane-related activities.
 |
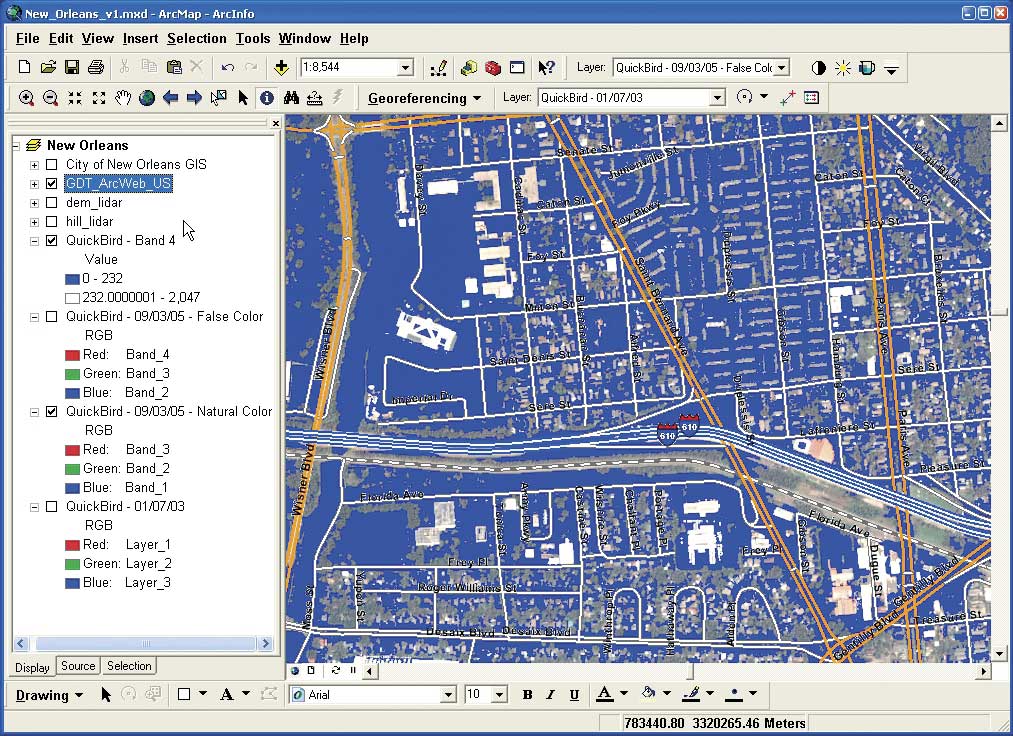
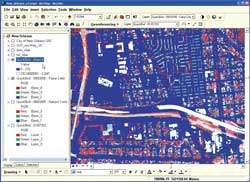
| Overlaying street network datasets supplied using commercial Web services with the classified flooded areas makes it easy to communicate which areas are flooded. |
By integrating, managing, and processing many types of geospatial data, GIS makes far more information available to decision makers and others responding to emergencies. Analysis of imagery taken of the aftermath of Hurricane Katrina captured by DigitalGlobe's QuickBird satellite illustrates the ability of GIS to integrate data and create actionable information.
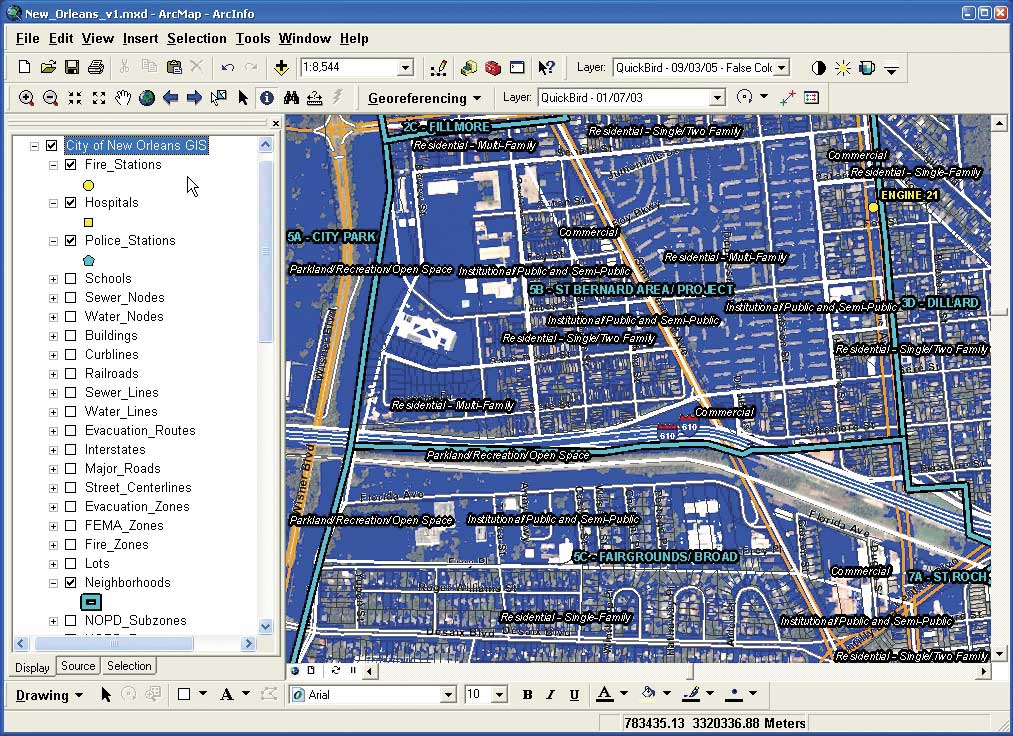
The first image shown at the top of this page is a view of New Orleans captured as a four-band multispectral image. The natural-color version is similar to satellite images of New Orleans, Louisiana; Biloxi, Mississippi; and other affected areas that were available from various Web sites almost immediately after the disaster. Like many of these images, this image is dark and details are difficult to discern owing to the collection angles used when capturing the imagery and the presence of smoke, haze, humidity, and other environmental factors that adversely affect image clarity. Although the public, largely unfamiliar with remote sensing data, could relate to these images easily, these images failed to answer the most urgent question, "What areas are flooded and damaged?"
Using GIS, a wealth of information can be learned from this DigitalGlobe imagery. Not only do decision makers and responders want to know where floodwaters are, but they also need to know where flooding is in relation to infrastructure, assets, and population.
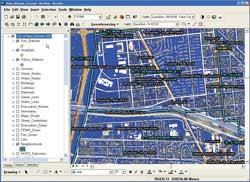 |
| Combining the imagery, classified flooded areas, and GIS data from the city of New Orleans shows flooding in relation to assets and infrastructure. |
A geospatial analyst knows that more data can be gleaned from the near infrared band than natural-color imagery and will use a false-color image that drops the blue band to greatly enhance the clarity of the image. Applying GIS data processing tools yields more information. The color stretches of the 11-bit imagery can be enhanced to take full advantage of the capabilities of the camera sensors and see more detail. Using GIS methods, the near infrared band (or all bands) can be quickly classified to create a flooded water mask.
By overlaying current street network data from a commercial Web service, such as Tele Atlas/TomTom, with the flooded areas, the extent of the flooding can be determined. Combining the image and water mask with GIS data from the city of New Orleans that includes the locations of assets (such as hospitals and fire stations) and infrastructure (such as water lines and building footprints) lets emergency managers assess damage to the community. While visualization is an important aspect of communicating geospatially referenced information, GIS provides capabilities for data integration and analysis that generate specific, actionable information. As part of the response to Hurricane Katrina, GIS helped direct rescue efforts, quickly apprise decision makers of complex situations, and collect information to locate missing persons.
|