October - December 2006
October - December 2006 |
||||||||
|
|
||||||||
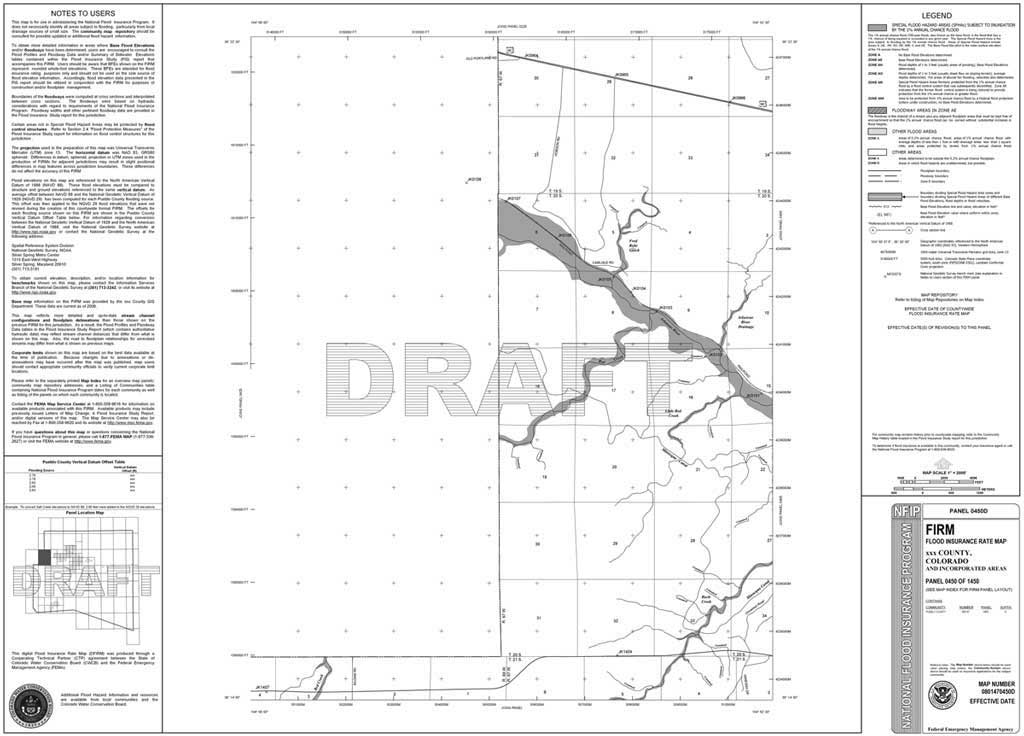
The process can be as simple as a direct conversion of a paper FIRM panel to a digital format. However, the process usually involves creating and obtaining new basemap data, such as transportation, political boundaries, and hydrography; creating new detailed studies; updating floodplains and vertical datum conversions; and other related operations. The final output is both digital basemap data and a set of DFIRM panels. These panels usually cover entire counties and use three different scales (1" = 500', 1" = 1,000', and 1" = 2,000'), depending on the amount of detail required for a specific area. The DFIRM panels will eventually be distributed as paper maps. The process of creating the panels and the associated graphics can be time consuming, but by using the built-in features of ArcGIS ArcView 9.1 and extending ArcGIS with ArcObjects, the process can be greatly simplified. Anyone familiar with the Map Modernization Project is aware of FEMA's three-volume series of guidelines and specifications that includes 15 appendixes. These guidelines and specifications help to maintain similar standards regardless of who produces DFIRMs in any county across the United States. Keeping track of these standards can be difficult because these documents change. ArcView's Style Manager and template files (*.mxt) are useful in managing DFIRM standards. [A style is simply a file that contains information about the redefined colors, symbols, symbol properties, and map elements that promotes consistency in mapping products.] With the Style Manager, the user can create a style that stores a variety of symbols. Although symbols are used for a wide variety of features, there are three primary symbol types�lines, markers, and fills. DFIRM maps require the three types of symbols: lines for primary roads, markers for benchmarks, and fills for floodplain zones. Because the attribute tables for features are also rigorously specified in FEMA manuals, it is easy to match symbols to attribute fields. The user can also set up symbols for labeling using the Style Manager. Each feature on the DFIRM has its own symbol and has a label associated with it. The label is symbolized according to the feature it references. Style and symbols can be saved in a layer file (*.lyr), and the symbology can be applied to a different data layer by changing the source of the layer file. The user is able to do this because the fields and attributes are predefined in the guidelines. Perhaps the most time-consuming part of generating the final panels for output is creating the associated graphics, particularly the annotation and labeling. Everything that falls within the floodplain, and within one inch of the floodplain, must be annotated/labeled; major features that fall outside of this area should be annotated as well. The typical workflow for creating the annotation includes creating label classes, creating the label styles, converting labels to annotation, and manually editing and modifying annotation. The Label Manager is used to generate Label Classes. A Label Class is a set of specifications that controls the text, look, and behavior of labels. Label content comes directly from a field in an attribute table or can be manually specified. Using the Label Expression builder, the user can create multiline labels, merge different fields together, or use only portions of an attribute field. The user specifies the content and behavior using SQL expressions. For example, creating a query in the Label Class that selects only primary roads will cause ArcView to label only primary roads with label class content, appearance, and behavior settings. The label's appearance (e.g., font, typeface, size) is determined by the label symbol that is set in the Style Manager prior to creating a Label Class. The user can change the appearance inside the label class.
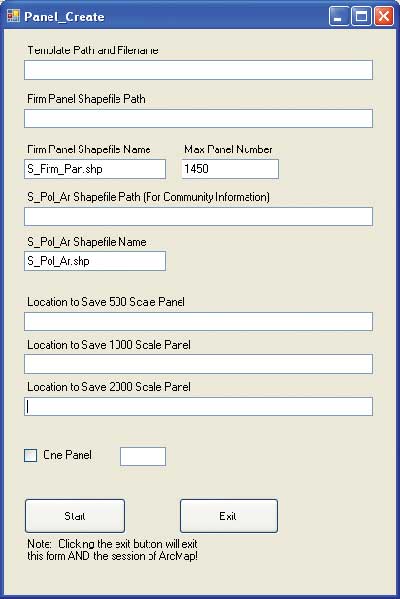
Part of the information stored with the label symbol is the label's placement properties. The placement properties control where and how ArcMap places a label (e.g., above or below the lines, perpendicular, parallel, horizontal). When the labels are turned on, ArcMap's Label Engine labels everything in a blanket "brute-force" manner. To improve on this and create only the labels the user may need/want at 1:500, 1:1,000, or 1:2,000 scales, the extent of the Data Frame should be set to the desired area before converting labels to a geodatabase annotation class. Doing this will save the labels in an external file that can be used repeatedly while retaining the class settings and the export scale. The only labels exported are those within the Data Frame's extent. During the export, ArcMap creates a new annotation class in the geodatabase. Inside the annotation class, ArcMap also creates annotation symbology that matches the Label Class previously set up. There was a minor problem with this method in ArcGIS ArcView 9 that was corrected in version 9.1. Sometimes the Label Engine will create a single label for a single polygon, although that polygon might actually span several different panels at several different scales. The user can copy this label to the necessary locations, but this can require considerable effort. A quicker solution is to start editing, set the new annotation class as the Active Annotation Target, and use the label tool on the draw toolbar to automatically add annotation of the relevant features to the map. The annotation is added to the annotation class in the geodatabase. Some of the counties in the western United States cover large swaths of land. Many panels—as many as 120 for a single county of typical areal extent—must be generated. Additional panels may also be needed if detailed studies, at a larger scale, are included. Creating a panel manually can take an hour and a half or more for a rough total of as much as 180 hours in one month. To expedite this process, a flagship program was developed using an open source integrated development environment (IDE) called sharpDevelop with VB.NET. The program readily integrates with ArcMap's .NET assemblies and provides an alternative for creating programs outside ArcMap. Note that sharpDevelop is not supported by Esri. Basically, the flagship program opens an ArcMap session, creates a new document based on the panel template, and calls a variety of Visual Basic for Applications (VBA) macros stored in the template that perform different functions associated with panel creation. These functions include updating the panel information, rotating the data frame, changing the data frame size, and determining which communities are shown on the panel. This program can generate all panels for a county of typical size in approximately three hours. Assuming an extra day or two for general panel cleanup, as much as four weeks can be saved. A method was also devised to easily make changes to the template text without having to manually change each map document file. Using text formatting tags became an essential part of this step. These HTML-like tags allow the user to format the text inside a single text box. For example, a word can be changed to bold in the middle of a sentence. Again, using VBA and ArcObjects, a simple piece of code was written that updates information on each panel. This information is stored in a separate location. There is no substitute for manual editing. It allows the user to control the final look and feel of a map. By using ArcMap's built-in tools and creating new ones using ArcObjects, these processes can be greatly improved. Also, because the standards for the Map Modernization Project are well defined, this methodology and the tools created for it are portable and can be applied to all counties. For more information, contact David S. Lamb, GIS Analyst Note from the author: This might not necessarily be the best method of panel creation in every instance. Companies that work on the Map Modernization Project may have already developed a personalized workflow. This continues to be a learning process for all who are involved, and good communication between team members is essential to learning what works and what does not. About the AuthorDavid S. Lamb has a bachelor's degree in geography from the University of Northern Colorado and is working on a master's degree in GIS through Manchester Metropolitan University. Lamb has more than seven years' experience in drafting and GIS work and has been working on FEMA's Map Modernization Project at Anderson Consulting Engineers, Inc., during the past year. |