Spatial Madness
By Brian Ward and Brian Davenhall, CH2M HILL, Inc.
An analysis of the NCAA Men's Basketball Tournament
Editor's note: Known as March Madness, the National Collegiate Athletic Association (NCAA) Men's Division I Basketball Championship has become one of the highest-profile sporting events in the United States since its inception in 1939. Teams from across the country compete in this single-elimination-format event. All games in the 20-day tournament are broadcast on television, and wagering on the tournament has become something of an event in itself.
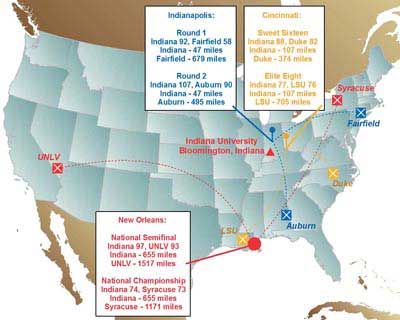
The authors' paper, presented at the 2006 Esri International User Conference, examined possible predictive correlations between the distance traveled by a team competing and its likelihood of prevailing. The paper presentation was well attended, and the paper, as well as comments received following the presentation, are the basis for this article. The accompanying article "Going the Distance—Did team travel make a difference in the outcome?" gives the uninitiated a sense of the excitement that the NCAA tourney engenders.
The authors' study considers the NCAA Men's Basketball Tournament since its expansion in 1985 to 64 teams. Over the 21 years included in the study, teams participating in the NCAA Men's Basketball Tournament have represented 46 states, with game locations in 38 states. While there is a cursory attempt by the NCAA tournament selection committee to place teams within logical geographic areas, more often than not, teams travel a significant distance away from their campuses to participate in games. Previous statistical analyses have found strong evidence of a correlation between home-court advantage and the outcomes of sporting events, but the primary aim of this study was to determine whether a predictive correlation exists between the distance traveled by a team and its likelihood for success.
Analytical Methods Used
Since the participants in the NCAA Men's Basketball Tournament and the game results are part of historical public record, this study used a previously compiled database that can be found at the HoopsTournament.net Web site. This spreadsheet-style Microsoft Access database contains a great deal of relevant information about each game from 1939 to 2005. The database was normalized, producing additional tables, such as Locations and Teams, that are related to the primary Games table. Each table included the city and state of each school or game location.
Using the Esri Data & Maps CD that comes with ArcGIS, the United States Cities layer was used to create an Address Locator for geocoding team and venue locations to the city level. These geocoded locations were generally produced with less than six miles of location difference. The authors believe this provides an acceptable spatial accuracy for analysis. Most entries in each table were matched with 100 percent confidence, though a few required manual, interactive matching. Where a comparable city located in the Address Locator was available, the city in close proximity was used. For example, Rutherford, New Jersey, served as a proxy to East Rutherford, New Jersey. In situations lacking an acceptable proxy, Wikipedia.com was used to locate the actual latitude and longitude for the city using World Geodetic System (WGS 84). The latitude and longitude were input as records in a new table. The new table was imported into a new personal geodatabase (pGDB) feature class using the Add X,Y function in ArcMap.
The Hawth's Analysis Tools extension for ArcGIS was used to determine the Euclidean distance between game and venue locations. [Hawth's Analysis Tools is a third-party extension developed by Hawthorne Beyer that performs a variety of spatial analyses and functions. It is available at no cost from www.spatialecology.com.] The Analytical tool Distance Between Points (Between Layers) was used to produce a comma-delimited text file that included the distance for each coincidence of all teams to all locations. This analysis yielded an almost unmanageable 35,000 unique records. The file was imported into Microsoft Access as a new table and a query was written that related this table to the original Games table through a multiple-field join of Locations and Teams.
For this analysis, the authors incorporated their basic understanding of the NCAA Tournament into a parsimonious a priori model selection and inference strategy. The covariates included for analysis were tournament seed (seed); Rating Percentage Index (RPI) rank (rpi); Euclidean distance to the game destination (distance); and three covariates derived by calculating the differences between competing teams for tournament seed (seed_diff), RPI rank (rpi_diff), and distance (distance_diff). For each model, a logistic regression analysis was performed in the R program for statistical analysis [a GNU project] using a generalized linear model (GLM) procedure. The binary response variable was created by calculating the difference in score between competing teams; negative values were assigned a code equal to 0, and positive values were assigned a code equal to 1. The Akaike Information Criteria (AIC) statistic was evaluated, then competing models were ranked using this statistic to determine the best-fitting model. Models that reported the lowest AIC values received the highest rankings. The 10 models evaluated and their corresponding results are presented below in Table 1.
| Model |
Covariates |
AIC |
Rank |
| 1 |
distance |
3675.582 |
10 |
| 2 |
seed |
3171.378 |
5 |
| 3 |
rpi |
3518.293 |
8 |
| 4 |
distance_diff |
3660.256 |
9 |
| 5 |
seed_diff |
2911.157 |
4 |
| 6 |
rpi_diff |
3251.220 |
7 |
| 7 |
seed_diff, rpi_diff |
2906.064 |
2 |
| 8 |
distance_diff, rpi_diff |
3242.727 |
6 |
| 9 |
distance_diff, seed_diff, rpi_diff |
2903.565 |
1 |
| 10 |
FULL MODEL |
2909.565 |
3 |
Table 1: Akaike Information Criteria model results
The model that included distance_diff, seed_diff, and rpi_diff reported an AIC=2903.565 and received the highest ranking. The model that included only the difference in seed between competing teams (model 6) reported an AIC=2911.157. This model ranked fourth and reported an AIC value very close to the highest ranking model. The models that included only distance or distance_diff reported AIC values equal to 3675.582 and 3660.256, respectively, and received the lowest rankings of all models. The full model, including all six covariates, received the third highest ranking.
Continued on page 2
|
