October - December 2006
October - December 2006 |
||||||||
|
|
||||||||
Before developing the data inventory, GIS analysts need to be familiar with the concepts and issues related to storm water management. The process of urban land development, either planned or unplanned, can considerably alter the hydrology of a watershed. Storm water runoff is a major component of the hydrologic cycle. Prior to any development, precipitation either infiltrates the ground or evapotranspirates into the atmosphere. Once land is developed, the impervious surfaces (e.g., buildings, roads, parking lots, or even turf grasses) reduce infiltration and evapotranspiration and eventually decrease groundwater storage and base flow. Rainfall and snowmelt generate nonpoint source pollution. The runoff transports nonpoint source pollutants, both man-made and natural, such as nutrients, pesticides, and bacteria, to the nearest streams, wetlands, and drinking water sources. In addition, the runoff flowing over impervious surfaces of highly urbanized areas absorbs enough heat to impact cold-water species. It also flows faster. This affects stream banks by accelerating soil erosion and sedimentation. All these factors result in increased and recurring flooding, greater stream bank erosion, and impaired water quality and aquatic habitat. Creating Data InventoryIn the last few decades, local municipalities in many parts of the United States have started adopting storm water management ordinances. Before such practices were adopted, water was typically routed from a developed site to the nearest waterbody in the most expedient way. A GIS-based data inventory not only helps monitor existing storm water management practices but also guides planning officials in analyzing vulnerable areas, retrofitting existing facilities, and identifying potential locations for implementing new storm water best management practices (BMPs). Local governments can create these inventories based on three major categories: base data, data on existing storm water management practices, and data on potential sites for implementing new BMPs.
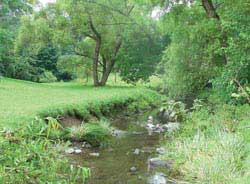
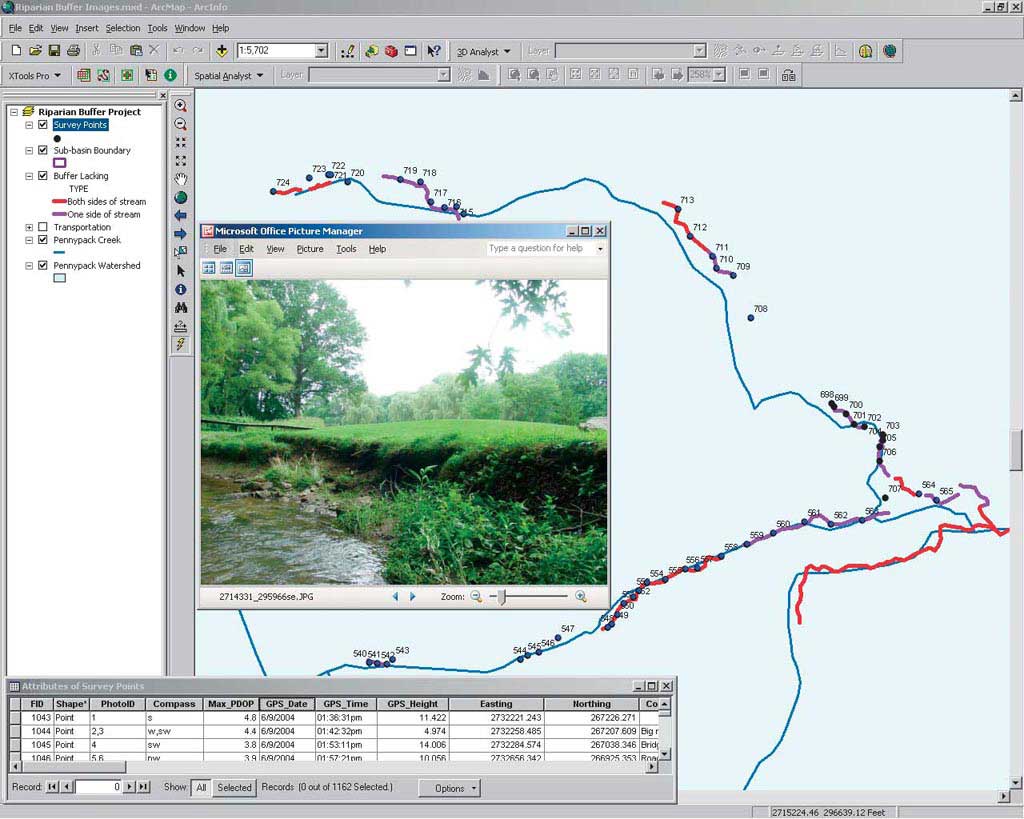
Base data may include digital elevation model, triangulated irregular network, contour, or other high-quality elevation data as well as orthophoto, watershed boundary, stream network, stream bank, natural waterbody or water reservoir, water distribution network, land use, soil type, tree canopy density, impervious surface, forest fragmentation, and riparian buffer data. Data on tree canopy density, available from the 2001 National Land Cover Database at 30-meter resolution, can be downloaded from the Seamless Data Distribution System Web site (seamless.usgs.gov). If strategically planted along stream banks, tree canopy coverage controls erosion, reduces the cost of structural storm water management, and lowers water temperature. The canopy also intercepts precipitation and gradually releases it into streams. Forest fragmentation plays an important role in preserving habitat and water quality. Using a free third-party ArcGIS extension called Hawth's Tool, various measures of forest fragmentation can be calculated including distances between forest patches and the proximity of forested patches to streams. [Hawth's Tool was developed by Hawthorne Beyer and is available from www.spatialecology.com.] The riparian buffer, the vegetated land adjacent to a stream, helps regulate water temperature, add organic matter, and reduce nonpoint source pollution. Assessments of riparian buffer can be done with the help of field surveys and recent orthophotos. The volume of runoff has increased because the amount of impervious surface area has increased. Artificial lawns converted from natural landscape and built on highly compacted soil also contribute to runoff. For regional analysis, impervious surface data can be downloaded from the National Land Cover Database. For smaller areas and more detailed studies, such data can also be also created by digitizing recent orthophotos. Data and assessment of existing storm water management practices should be primarily based on field visits and surveys. Following a GIS-based suitability study output, the data inventory should also include the locations for possible BMP implementation such as school campuses, large retail developments, and golf courses. The local municipalities can develop a facility inventory for all public properties in a watershed. The site information may include attributes such as parcel size, area of pervious and impervious surfaces, and area of recreation and athletic spaces. A matrix can be developed from this data and included in a final plan to prioritize future potential retrofit sites. Sample ApplicationsOnce an inventory is created, GIS analysts can use these datasets in various storm water management applications. The Center for Sustainable Communities at Temple University in Pennsylvania has been creating such inventories for local municipalities of southeastern Pennsylvania. One of the center's projects was based on a riparian buffer assessment of Pennypack Creek watershed. The Heritage Conservancy, a nonprofit regional conservation organization, previously identified segments of the Pennypack Creek and its tributaries that lack riparian buffer on either one or both sides of the stream. The center's project complements this existing data with new visual information. Each riparian buffer point was associated with pictures of the stream, its tributaries, and its banks, providing a better indication of riparian buffer quality. Thousands of digital images were captured, and locations of all the survey points were recorded using a GPS receiver. These points were mapped using the captured x and y coordinates and were provided unique ID numbers. The images were hyperlinked to the relevant survey points in an ArcMap document. Whenever there was more than one image for one location, the images were stored in separate Web pages and those pages were hyperlinked to respective points as well. In addition, the center has assessed existing storm water management practices and identified candidate locations for future BMP implementations throughout the watershed. Field data for this 21-mile assessment area was added to the GIS either as point, line, or polygon features, along with detailed notes stored in the associated attribute tables. The assessment map uses several symbolization categories. Some examples are existing BMPs, BMP needed, BMP badly needed, BMP retrofit, high water marks, and obstructions. Another project the center is undertaking in an existing flood-prone office park is based on the theme "green street design." Green streets play an important role in storm water management by reducing impervious surfaces and decreasing runoff. ArcGIS will be used in siting streets, determining street widths, and creating drainage designs. The center is using the software to avoid locating streets and parking lots in low areas and highly permeable soils. This methodology will help preserve the natural drainage pattern. In addition to ArcGIS and its extensions, Trimble GPS Pathfinder, Adobe Photoshop, and Microsoft FrontPage were used in these projects. For more information, contact Md Mahbubur R Meenar About the AuthorMd Mahbubur R Meenar is a past contributor to ArcUser magazine. He is the senior GIS design specialist at the Center for Sustainable Communities and adjunct assistant professor at the Department of Community and Regional Planning at Temple University. His research interests include environmental modeling, natural disaster management planning, water resources planning, and three-dimensional GIS simulations. He can be reached at meenar@temple.edu. Sample data layers: checklist for local government officials
|