Fall 2009
Fall 2009 |
||||||||
|
|
||||||||
The New York State Department of Environmental Conservation (NYSDEC) has developed a custom GIS application that assists its staff in preserving biodiversity in the state by answering spatial questions related to threatened and endangered species. There is increasing concern over the loss of biodiversity. Species are declining or becoming extinct at a greater rate than at any other time in the history of life on earth. Today, many species are severely threatened by the reduction of available habitat caused by changing land use. This leads to the isolation of these species' populations and higher mortality rates for them. This threat has become increasingly problematic in New York's Lower Hudson Valley/Catskill Region. In this unique area of the state, several ecozones are clustered in a relatively small geographic area. The region's diverse habitat types support a correspondingly high degree of wildlife diversity with 90 percent of the more than 400 birds, mammals, reptiles, and amphibians native to New York found in this 4,700-square-mile area. Fifteen of these species are either threatened or endangered and classed as Listed Species. This extraordinary biodiversity is coupled with a large and ever-increasing human population. With 2.5 million current residents and all seven of the region's counties ranked among the fastest-growing counties in the state, the area is one of the most rapidly developing locations in the northeast. Locations experiencing the greatest human population growth also contain a significant proportion of statewide populations for several Listed Species. Incorporating GIS into the Review ProcessConserving and protecting unique natural assets is a core mission of NYSDEC. Biodiversity conservation and the protection of Listed Species are top priorities for the NYSDEC Division of Fish, Wildlife & Marine Resources. NYSDEC relies on its regulatory authority and the environmental permitting program to protect species and their habitats. The department uses GIS and data from the New York Natural Heritage Program (NYNHP) throughout the environmental review process. The NYNHP database provides detailed, up-to-date information on New York's biodiversity, including documented locations of Listed Species. However, disturbances at sites far from these locations can significantly affect a Listed Species. When considering the impacts of a proposed project, it is important to know not only where the species occurs but also the Impact Zone for that species. This zone is the area surrounding the species location where project-related actions may affect the species.
The NYSDEC Division of Environmental Permits is responsible for administering the jurisdictional permit programs and overseeing the review of proposed projects that may be subject to environmental conservation laws. To determine whether a permitting decision can be reached or if further review is required, permit analysts and biologists must answer resource protection questions such as, Is the project site in close proximity to any Listed Species locations or jurisdictional wetlands? and What habitat features and land uses occur in the surrounding landscape? In the not too distant past, these questions were answered using paper maps and transparent sheet overlays. Now the use of ArcGIS software has greatly improved the ability of staff to answer these and other spatially related questions. The region's current rate of development challenges the staff's ability to process an enormous number of permit applications in a manner that is consistent while sufficiently protecting natural resources. Solution Guides ReviewThe solution to this situation was a custom GIS application for a screening project that can be used to guide the regulatory review process. The Endangered Species Screening application was developed in ArcInfo 9.3 as a template and enhanced using ArcObjects and Visual Basic for Applications (VBA), the integrated programming environment embedded in ArcGIS software. The template opens with several custom toolbars, tools, and commands, along with all data layers necessary to complete the screening process. The application is designed to
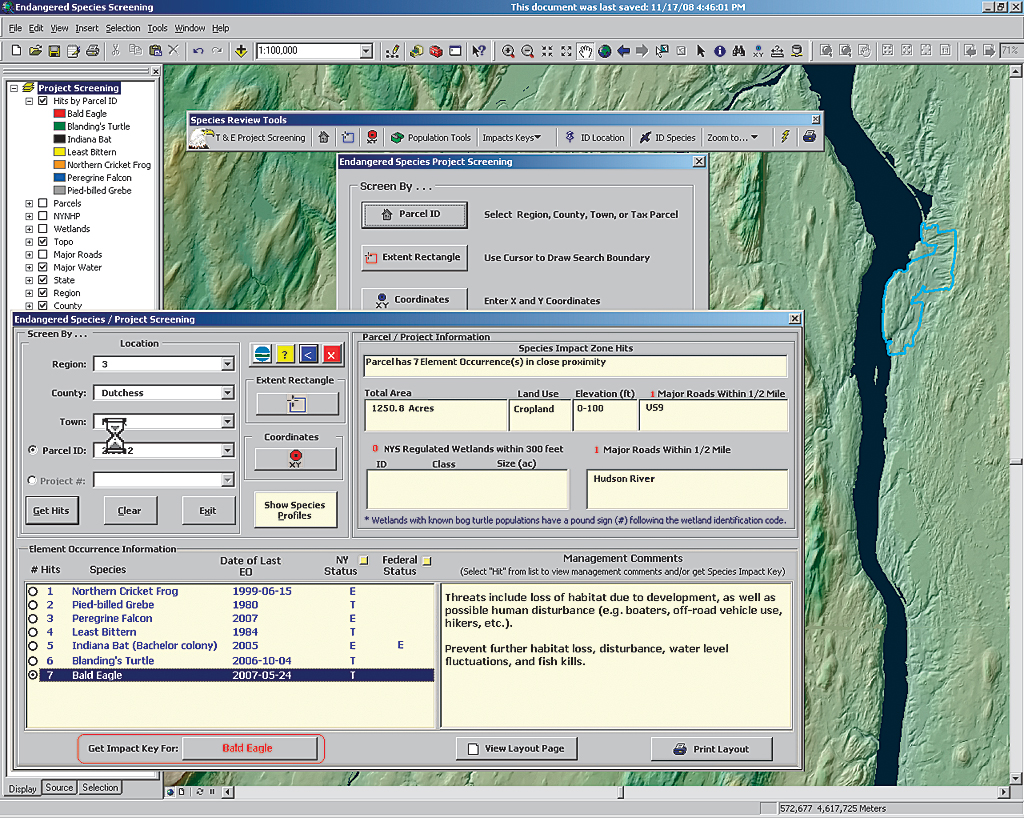
The screening process is initiated by selecting one of the three search methods: Parcel ID, Extent Rectangle, or X Y Coordinates. The search tools use the obtain element occurrence (EO) polygons for each Listed Species from the NYNHP biodiversity database. Impact Zones are derived from the EO polygons using criteria specific to each species. Each search tool searches the user-defined location, zooms the map to the extent of the selected location, and expands the form window to display site-specific data. If a search returns one or more hits, the window expands further to show each individual hit as well as the associated attribute information necessary for the screening process.
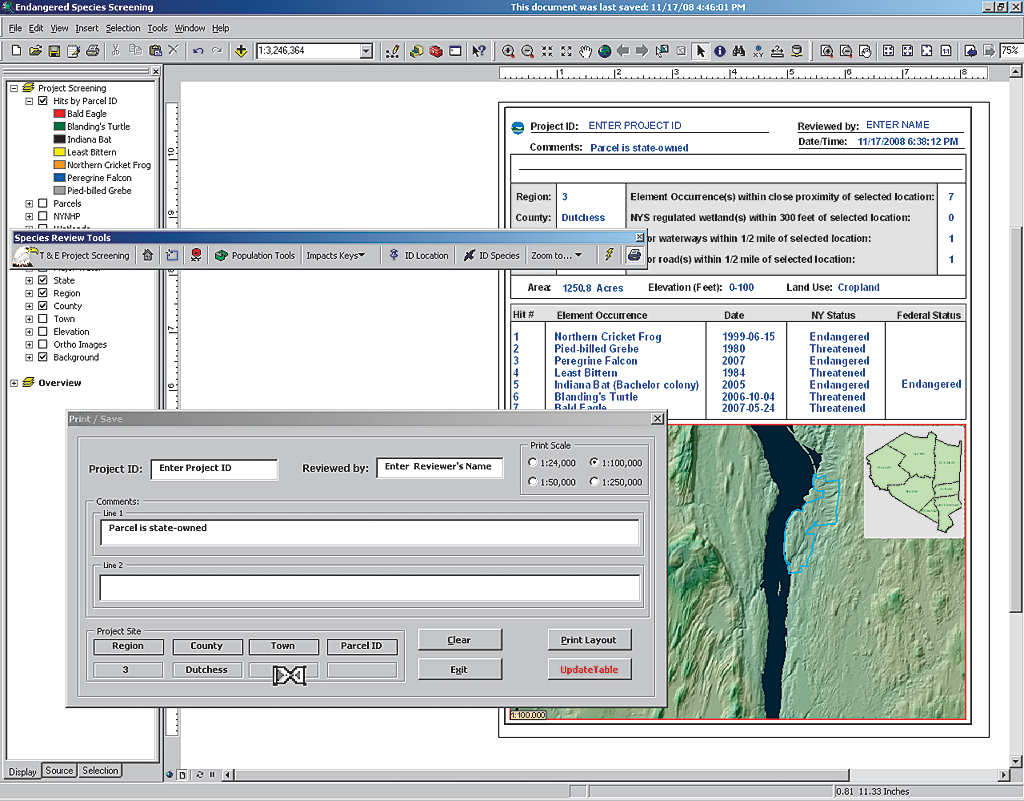
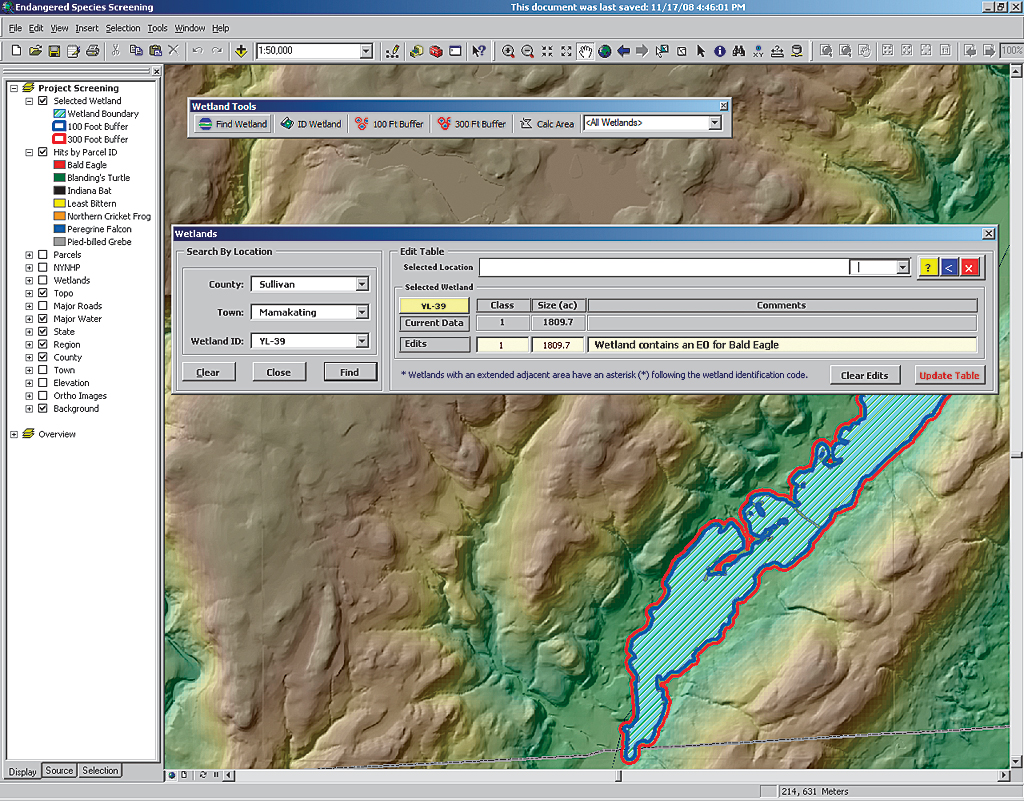
Selecting a hit displays management comments recorded for the specific EO and location. The entire procedure is done behind the scenes and eliminates the need for the user to conduct an on-screen analysis of the data layers to determine hits associated with a proposed project site. Along with a location map, the EO and project site information retrieved by the search tool are displayed in the template's Layout View. The Print Results tool opens a dialog box that can be used to enter additional project information or alter the scale of the location map. The print command in the dialog box can be used to send the layout page to the printer or save the document as a PDF file. Added Support for UsersTo assist with the preliminary assessment of the potential for project-related impacts from certain actions, the user can select items from the search results list that opens up a dichotomous impact key. This key contains a series of species-specific Yes/No questions that guide the user through the assessment process. Each branch of a key ends with a Recommended Action section that indicates the next step in the review process. This section also provides links to survey protocols, potential mitigation measures, and additional resources. From this screen, the species' population distribution can also be added to the map as a separate layer. The Population Tools toolbar contains customizations that are helpful when screening projects involving species that typically exhibit a metapopulation structure [i.e., populations of the same species that are spatially separated but interact in some way] and/or species that are particularly vulnerable to fragmentation, or where clustering of individuals may be important. For each species, these tools display a message box indicating the number of known populations within a given search distance from either the location clicked on the map or from user-supplied x,y coordinates. The tool adds the search results to the map as a temporary selection layer. The Threats to Species button provides a quick reference to the major threats and statewide or local conservation and management efforts associated with each species. The Find Wetland tool returns a list of New York State jurisdictional wetlands that contain EOs for the selected species and location. Selecting a wetland ID number in the search results list of either tool zooms the display to the extent of the wetland. Clicking on the wetland polygon with one of the custom buffer tools creates graphics around the selected wetland at user-defined distances. ConclusionThe Endangered Species Screening application was developed to more efficiently process environmental reviews by allowing regulatory staff to navigate through the screening process, access all essential data, and make informed decisions about the potential for project-related impacts. In an area of New York State experiencing drastic landscape changes, GIS technology will continue to play an increasingly important role in helping accomplish the conservation objectives of NYSDEC. For more information, contact Steve Joule, Endangered Species Biologist |