
|
|
|||

|
Three-Dimensional Databases in ArcView GIS�and Beyond by Daniel Elroi, Independent GIS Consultant The ArcView 3D Analyst extension for ArcView GIS has finally opened the door to implementation of three-dimensional databases on the desktop in an Esri-based GIS environment. Three-dimensional databases have been created for a nuclear waste repository and for mining projects in the past three years. This article describes the basic techniques for implementing such databases as well as identifies potential links between ArcView 3D Analyst and other three-dimensional software packages. 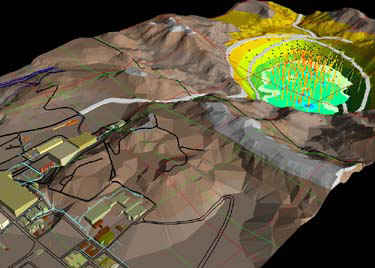
Chances are that a common experience for most GIS professionals is having to explain that GIS is two-and-a-half dimensional. For professionals who deal with natural and constructed earth phenomena, it has always been difficult to explain why a geographic information system can only view such phenomena with one eye closed, as it were. Well, no more! Since the introduction of the ArcView 3D Analyst extension, ArcView GIS users have finally been able to construct, study, and view three-dimensional databases. Now desktop GIS can assume a more central role as an integrator of various software packages and databases that can handle the third dimension. The Problem: The Earth Isn't Flat, nor Is It Hollow No, the earth isn't flat; nor should an information system that describes and analyzes it be flat. In the real world, vertical surfaces really do exist as do spiraling lines, clusters of points, and solid masses. The complexity of analyzing three-dimensional data increases exponentially relative to two-dimensional data. Consequently, this analysis is better performed by more specialized software. However, GIS ought to at least be able to address and view such data. A Solution: ArcView 3D Analyst Extension The ArcView 3D Analyst extension for ArcView GIS, released about two years ago, is designed to support three-dimensional databases in a way that is integrated with Esri's traditional data structures. To do so, ArcView 3D Analyst uses three-dimensional extensions to the published shapefile format: three-dimensional points, polylines, three-dimensional polygons, and three-dimensional triangulated surfaces (TINs). This extension does not support the concept of true solid objects, three-dimensional grids (known as voxcels), or the creation of envelope TINs, but the objects that are provided can be used to visualize almost any three-dimensional object. As with other objects that can be viewed by ArcView GIS, these three-dimensional objects may be identified interactively, queried, and linked to any databases to which ArcView GIS can connect. Using ArcView 3D Analyst in a Nuclear Waste Repository In mid-1997, Westinghouse Government Environmental Services Company completed a two-year software development project on behalf of the United States Department of Energy. The Waste Isolation Pilot Plant (WIPP), located in southeastern New Mexico, is an underground facility designed for the safe disposal of low-level radioactive waste. Knight Pi�sold LLC, an engineering firm in Denver, Colorado, with whom the author acted as GIS manager for about six years, performed the actual programming for the project. The Spatially-referenced Geotechnical Information System (SrGIS) was developed for this project using a combination of ArcView GIS, ArcInfo, Microsoft Excel, Delphi, and dBASE. SrGIS enables geotechnical engineers at WIPP to track movement in the rock surrounding the repository. Since the ArcView 3D Analyst extension was not available during the development of SrGIS, an innovative approach was used to represent three-dimensional space. However, soon after the project was completed, as part of an internal research project, Knight Pi�sold programmers imported the entire underground repository database into ArcView 3D Analyst. Without ArcView 3D Analyst, the complex geometry of the repository had to be greatly simplified for display and management. With the extension, a more realistic view of the facility could be displayed. The original SrGIS helped users distinguish between instruments placed in the roof and floor of an underground space by displaying two separate but linked views. With ArcView 3D Analyst, a user was able to "walk" into the space and clearly view the instruments above and below. The SrGIS user was unable to clearly distinguish between stacked objects such as waste drums placed on top of each other. With ArcView 3D Analyst a user could navigate around objects in three dimensions and clearly pick out a variety of objects. 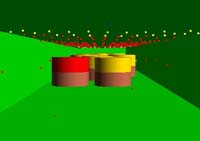 9
All three-dimensional objects were constructed simply by extruding flat two-dimensional objects by their height attribute. The base elevation of objects was determined either by their absolute elevation, as in the surface facilities, or by draping them on TIN surfaces, as in the repository rooms that follow a particular layer of salt. Interactive navigation through the repository at a reasonable speed was made possible primarily through the use of a fast graphics card (8 MB) and a relatively fast computer for its time (Intel Pentium 200 MHz, using Windows NT). 9
All three-dimensional objects were constructed simply by extruding flat two-dimensional objects by their height attribute. The base elevation of objects was determined either by their absolute elevation, as in the surface facilities, or by draping them on TIN surfaces, as in the repository rooms that follow a particular layer of salt. Interactive navigation through the repository at a reasonable speed was made possible primarily through the use of a fast graphics card (8 MB) and a relatively fast computer for its time (Intel Pentium 200 MHz, using Windows NT).
Mining, Oil, and Gas Projects in Three Dimensions GIS continues to gain ground in the mining and oil and gas industries. One of the most difficult aspects of incorporating data into GIS databases is the three-dimensional nature of the data. At the beginning of an exploration project, three-dimensional borehole data is collected by geologists. Later, this data is modeled to determine the geology and mineralogy of the area and, ultimately, the shape and nature of the deposit. In the case of mining, the final step is often the development of a three-dimensional mine plan to guide the construction of the mine and the removal of the ore. The ArcView 3D Analyst extension can be used to help incorporate this data into a GIS and pass information back to the specialized software packages that handle this data. The three types of data that are most important and difficult to transfer from borehole logging, geologic modeling, and mine planning packages into GIS packages are
Borehole information can be read from a variety of ASCII formats that are commonly used in the oil and gas and mining industries or from the three-dimensional polylines created by software packages that can output three-dimensional document exchange format (DXF) files. 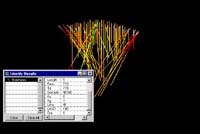 This example shows how data was imported from ASCII files. Each borehole segment was imported as an individual three-dimensional line with all attributes. Each borehole can be addressed as a whole by referring to its borehole ID. The resulting database is small enough to be viewed and queried on an average laptop PC. This example shows how data was imported from ASCII files. Each borehole segment was imported as an individual three-dimensional line with all attributes. Each borehole can be addressed as a whole by referring to its borehole ID. The resulting database is small enough to be viewed and queried on an average laptop PC.
Surfaces and Ore Body Envelopes ArcView 3D Analyst can generate its own TIN surfaces but cannot generate TIN envelopes that completely encompass a solid. However, because ArcView 3D Analyst can read three-dimensional Computer-Aided Design and Drafting (CADD) files, it is often quite straightforward to import TIN envelopes from modeling packages as long as an intermediate format such as DWG (AutoCAD's proprietary drawing file format) is used. If this option is not available, TINs can be exported to ASCII files and then imported as three-dimensional polygons by means of custom scripts. This has the same visual effect as if TINs had been imported. These three-dimensional polygons can then be used to generate TINs using the ArcView 3D Analyst TIN engine. However, this step is not necessary for visualization purposes. Block Models Depending on the software package, importing block models can be a little more tricky. Importing a raw block model requires that each and every three-dimensional cell is brought in. In this form, each cell turns into six separate three-dimensional polygons. So far, importing raw block model data has proven to be too slow and cumbersome. A possible solution is to preprocess or filter the gridded data until the enveloping geometry of clustered data can be determined and then turn it into a smaller number of three-dimensional polygons. One solution that does work is to export each level (horizontal slice) of the block model as a polygon layer (e.g., by exporting it as a DXF). Each slice can then be placed at the correct elevation and extruded by the slice thickness whether or not it is uniform. A block model can be re-created in this way. Where Is All This Taking Us? GIS is exceptionally well suited for managing and displaying spatial data. More and more non-GIS spatial packages, such as CADD software, are assuming limited GIS capabilities. Nonetheless, GIS remains the leader in spatial and tabular data integration. The ability to address three-dimensional data will continue to strengthen this capability as illustrated by the following examples:
And the Road Beyond? Just as three-dimensional GIS makes it possible to integrate various three-dimensional spatial data, the World Wide Web is making it possible to publish these integrated data sets in a very broad and inexpensive manner. 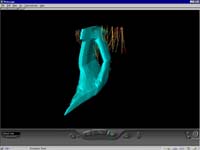 ArcView 3D Analyst can export three-dimensional scenes into virtual reality modeling language (VRML) files. VRML, a three-dimensional graphics language used on the Web, lets users view and interact with the three-dimensional scenes using a Web browser with the appropriate plug-in. ArcView 3D Analyst can export three-dimensional scenes into virtual reality modeling language (VRML) files. VRML, a three-dimensional graphics language used on the Web, lets users view and interact with the three-dimensional scenes using a Web browser with the appropriate plug-in.
ArcView GIS exports the scene in a VRML format that can only be rotated, zoomed, and panned. With the aid of VRML editing software and some programming, it is quite feasible to create a fully interactive VRML scene. An enhanced scene allows layers to be turned on and off, items to be clicked on to reveal their attributes, different programs to be invoked, video or sound files to be played, and links to other Web pages to be activated. This approach to presenting three-dimensional GIS-compiled data should sound familiar. A similar approach was taken with MapObjects. Applications created using MapObjects can be accessed from a browser so that a broad nontechnical audience can view and interact with complex data sets created using ArcInfo and ArcView GIS. The ArcView 3D Analyst extension has enabled ArcView GIS to bridge a gap between traditional two-and-a-half dimensional data and true three-dimensional data. While this does not give ArcView GIS the ability to perform the functions of other industry-specific three-dimensional software packages used for geologic modeling or mine planning, it does permit an easier exchange of information between such packages. This is beneficial to users of both GIS and other modeling software packages. The tools are basic, but the capability is there waiting to be explored. The author thanks Mike Price, the mining industry manager at Esri, for his help in creating the illustrations for this article. For more information, please contact Daniel Elroi Independent GIS Consultant Denver, Colorado, USA Tel.: 303-355-4-GIS Fax: 303-975-5223 E-Mail: daniel@elroi.com www.elroi.com About the Author Daniel Elroi is an independent GIS consultant and programmer residing in Denver, Colorado. For the past thirteen years he has been implementing GIS systems, consulting, and programming for employers and clients in local, state, and national governments, as well as in the pipeline, oil and gas, mining, and real estate industries. He is a frequent speaker at GIS conferences, and specializes in the application side of GIS. Daniel is a native of Israel and a graduate of the University of California, Los Angeles.
|