A Creative Approach for Representing Temporal Data
 |
| Members of the Earth and Environmental Science Division at the Los Alamos National Laboratory in Los Alamos, New Mexico, represented chemical concentration data for analyte samples that had been collected at numerous groundwater monitoring sites over a period of many years. |
For centuries, maps have proved to be an extraordinarily efficient method of communication. From a map scrawled on a scrap of paper to the most elaborate three-dimensional representation, people have used maps to convey often complex information within a geographic context.
Although a map's subject is often some representation of the physical world, maps are always abstractions. The mapmaker's challenge is selecting, emphasizing, and symbolizing data in a way that communicates specific information accurately to the map reader. With regard to point symbols, this is accomplished through the skillful use of hue, orientation, shape, size, spacing, and value when creating symbols.
An increasing number of GIS users need to represent temporal or time dependent data on maps in a meaningful and concise manner. The ability to analyze and combine data for both spatial and temporal patterns in a single graphic is challenging.
Members of the Earth and Environmental Science Division at the Los Alamos National Laboratory in Los Alamos, New Mexico, needed to represent chemical concentration data for single chemical (analyte) samples that had been collected at numerous groundwater monitoring sites over a period of many years. In some cases, sample data had been collected as far back as 1950.
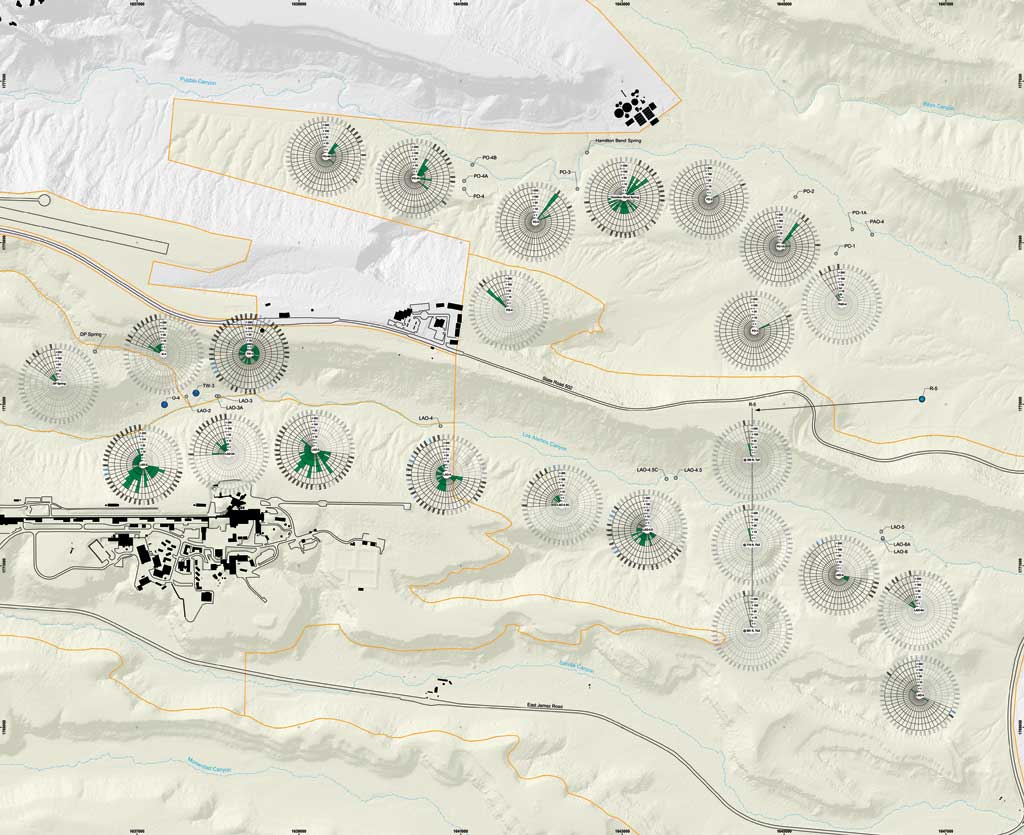
The goal was to display this complex temporal data on a map so the map reader could easily visualize the movement and change in concentration of the analyte, both horizontally and vertically, and assess the potential for the analyte reaching the water table.
Map authors Chris Echohawk, Diana J. Hollis, Thomas L. Riggs, Doug E. Walther, and Marc S. Witkowski employed an elegant and inventive solution: clock diagrams. Clock diagrams are analogous to the rose diagrams that are often used to depict wind direction or strike direction in geologic applications. The specialized clock diagrams used on this map were generated for the processed sample values for each year of sampling at each location.
The authors developed a methodology for creating these diagrams that employed ArcGIS 8.3 and Microsoft Excel. First, analyte detection values were provided at sample locations by year and depth of sample. The original values were averaged for each year and cross tab queried by each sample location. Then sample values were grouped into ranges to simplify the display.
 |
| Each clock diagram graphic was placed on the map based on the location of the well where the samples were collected. |
Next, all data was read into code written for creating the clock diagram graphics. The diagrams were generated. Finally, each clock diagram graphic was placed on the map based on the location of the well where the samples were collected. Depth of sample was indicated by classification of the sample location points. Locations with samples at multiple depths were shown by placing the diagrams with increasing depth down a line extending from the sample location.
Although representing temporal data through the use of clock diagrams is not entirely novel, the use of multiple clock diagrams to emphasize the movement of sampled data over time is new. The clock diagram code and method have proven to be effective means for identifying temporal and spatial trends when analyzing groundwater data.
This map, entitled "A New Method to Represent Temporal Data Sets," is one of many outstanding maps that were included in Esri Map Book, Volume 19, GIS—The Language of Geography. For more information about this map, contact Thomas Riggs of the Los Alamos National Laboratory at tlriggs@lanl.gov.
|