October - December 2007
October - December 2007 |
||||||||
|
|
||||||||
This formula appears simple. It requires only births, deaths, and an estimate of the migration to and from the area in question. But the simplicity is deceptive. Unfortunately, births and deaths are reported for states and counties, not for census tracts; census block groups; or the small, subcounty areas that data users prefer. Migration is not reported at all. Migration data must be estimated indirectly from data that is symptomatic of population movement. How can demographic change be estimated from housing information? Housing units can be updated with local permits. This data is more accessible than the components of population change, and the technique is simple—linear change. This approach seems to be easier than estimating population change. It is certainly more popular, especially among GIS analysts. However, the housing unit method produces mixed results because it, too, is deceptively simple. The issues raised by simple estimation techniques can be addressed by sharing some tips that Esri's data development team uses to assess and apply data. This example uses building permits to estimate local housing change. Evaluating Public Data SourcesThe process begins by identifying public data sources for housing change. Including revisions, the latest decennial census count is the housing base. To estimate current housing units, apply the component formula that updates the base inventory (HU0) to a later date (HU1) by means of linear change as shown in Figure 2.
At least two components of housing change can be obtained from local agencies that issue permits for residential construction or demolitions. While the United States Census Bureau also compiles building permits for permit-issuing places, counties, metropolitan areas, and states, information about housing completions (or certificates of occupancy) and demolitions must be obtained from local agencies. Current estimates of total housing units that can be used for comparison include annual estimates for states and counties and American Community Survey (ACS) data for places or counties with a population of 65,000 or more. Both these sources are supplied by the Census Bureau. Housing unit estimates can also be obtained from state or local agencies. Data on residential delivery counts reported by the U.S. Postal Service for postal carrier routes can also be used. Some redundancy is evident in these sources. However, evaluation entails comparing different sources of data. All data sources, even Census Bureau sources, are flawed. Therefore, each data source should be checked against other available databases. This step begins with a review of the variable definitions and methods used to provide each data source. The term housing unit—defined as separate living quarters with direct access from a common hall or outside—encompasses anything from a house to a single room. Occupancy is "the usual place of residence." The Census Bureau considers a "home" as the place where a person spends most of his or her time. However, ACS defines the usual place of residence as any unit where the person lives for at least two months. Therefore, housing units that the Census Bureau reports as seasonal vacancies in the census data may be noted as occupied housing units by ACS. However, while definitions of occupancy differ, the estimates are identical because the census housing unit estimates are used to weight the ACS survey of housing units.
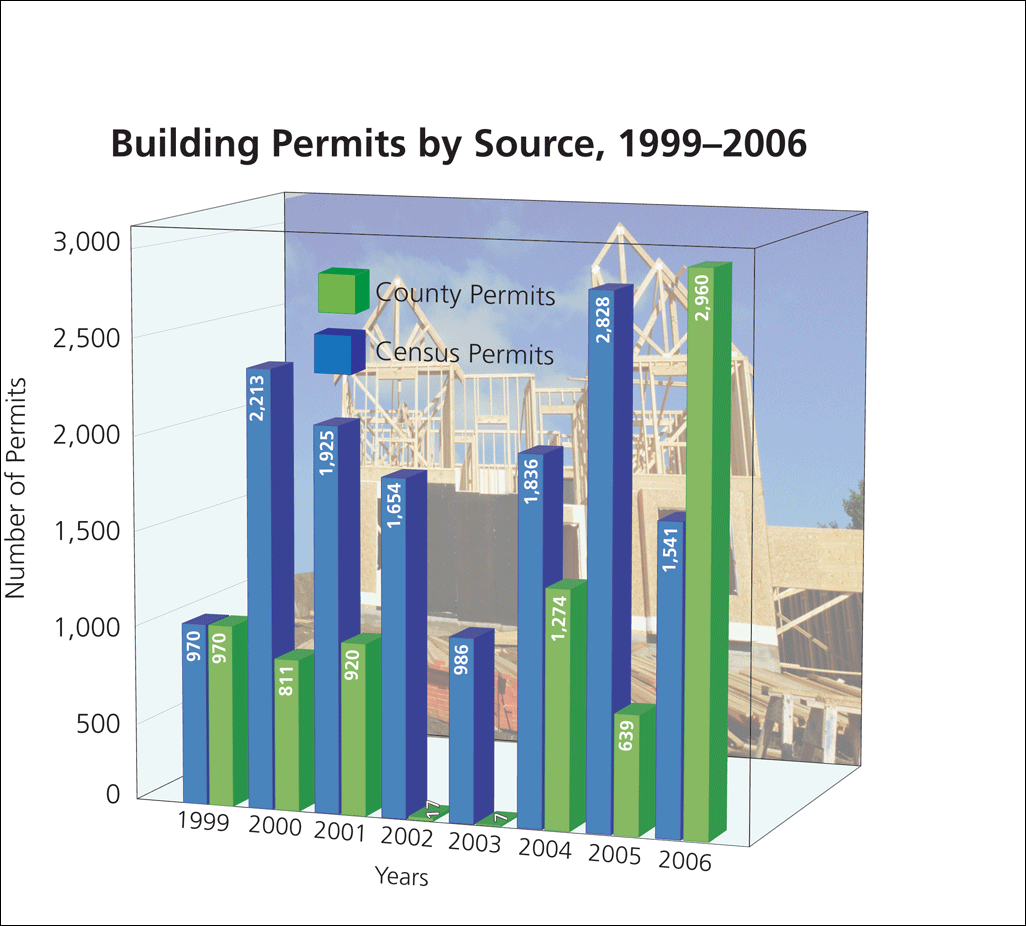
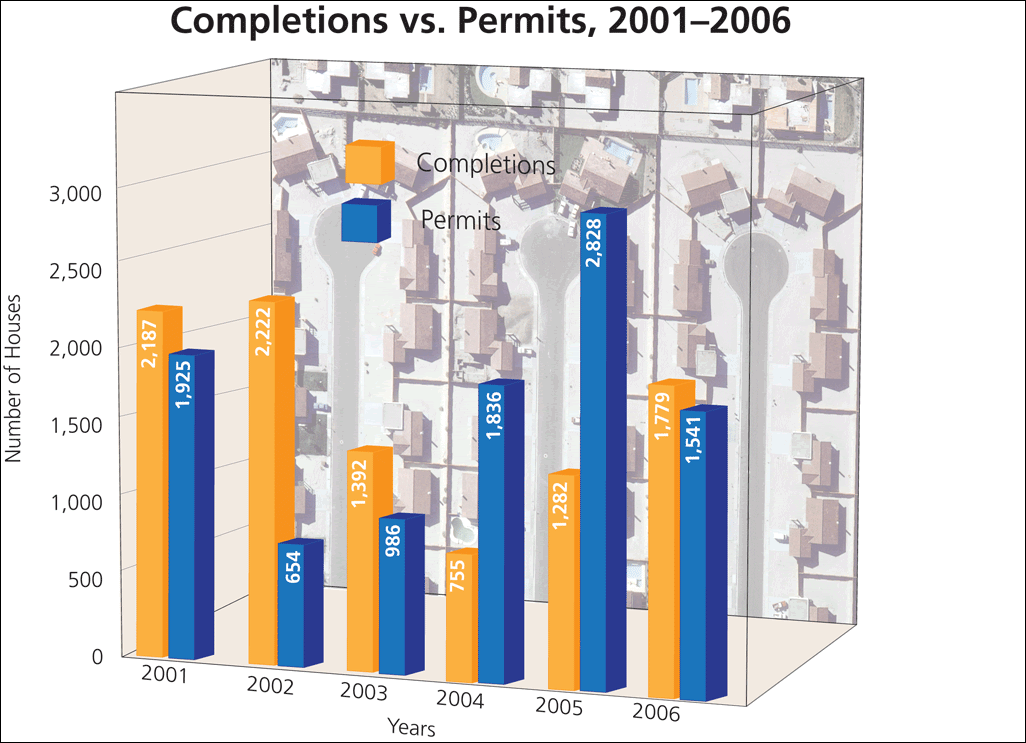
Building permits are commonly used to indicate residential growth. By definition, building permits represent authorized residential construction. The Census Bureau collects information about building permits through a mail survey of permit offices. Although this monthly survey may not include all offices, the annual summary is expected to be inclusive. Theoretically, local permit offices report the same data to the public and the Census Bureau. However, as the chart in Figure 3 shows, the number of permits reported is not always the same. Building permits are not the same as housing completions. Construction on some projects may be delayed or abandoned, and building permits for these projects may not be updated or may be canceled. Some types of units, such as townhouses, may be reclassified. The Census Bureau defines a townhouse as a single-family structure, but local permit offices may classify a townhouse as a multifamily structure. Housing starts are reported by the Census Bureau for the United States but not for local areas. Local agencies may maintain a separate series of either housing completions or certificates of occupancy. Figure 4 compares building permits to housing completions for the same county shown in Figure 3.
Residential growth is only one component of housing change. The loss of residential units may be included by estimates of demolitions. There is no national source for this information. The Census Bureau estimates this component of housing change from the reasons given for noninterviews recorded in the American Housing Survey (1997�2003). Local offices may also record demolitions by permits. Putting the Data on the GroundEvaluating a data source must include its spatial component. Often, the geographic level of the data source differs from that of the analysis. For instance, the analysis calls for building permits by census tracts, but the only data available is building permit information for county planning districts. This discrepancy in geographic level requires spatial conversion. While various methods of conversion are available, the same critical view of the data sources, previously discussed, is applied. These three approaches can be used when converting data to a common level of geography. Given that the source and analysis layers differ but overlap, the most intuitive approach is to exploit the land area of the two layers that overlap within a GIS framework. Summary data is apportioned from the source layer to the analytic layer in proportion to land area. This areal proportional allocation assumes the even distribution of the attribute being converted. Waldo Tobler, professor emeritus at the University of California, Santa Barbara, who is known for formulating "the first law of geography," introduced the pycnophylactic method to avoid this assumption of even distribution. The method subdivides each geographic unit in the source layer into grid cells and smoothes the cell value based on the neighboring cells to produce a more realistic distribution of the attribute. Dasymetric mapping [method of thematic mapping that uses areal symbols to spatially classify volumetric data] and ancillary data, such as road network and land-use data, can provide additional information on how the data is distributed. The point-in-polygon method of data conversion is available in ArcGIS Business Analyst 9.2. It is used primarily to aggregate data from census block groups to a user-defined trade area, for example, a three-mile circle around a street intersection. But it can also be used to convert data between two incompatible layers. Converting from a layer with larger geographic units to another layer with smaller units would likely result in higher errors than doing so between two layers of comparable size. Aggregating data—converting from small to larger units—tends to have fewer errors. It may be difficult to generalize a quantitative comparison of the different methods, since the data used in the conversion test may not represent other situations or data types. The effectiveness of the ancillary data in the dasymetric approach is a function of the attribute being converted. If at all possible, a user should test a method against independent results, even for a small number of geographic units. The main point is to be aware of the assumptions behind the methods. Geocoding Point DataAnother type of spatial conversion deals with point or address data—the process of geocoding. Evaluating the point locations assigned to addresses is an important aspect of quality control. Esri geocodes more than 113 million addresses each year that are assigned geocodes using the composite locator in ArcGIS Business Analyst 9.2. The composite locator assigns a geocode using a cascading fallback approach that uses a primary and secondary locator. The methodology is outlined in the following four steps and demonstrated in the accompanying sidebar, "Identifying Geocoding Errors."
In short, the results of geocoding must also be checked during data evaluation. The composite locator in ArcGIS Business Analyst 9.2 is a powerful tool for identifying inconsistencies in geocoded data. Correctly geocoding addresses requires knowledge of the data as well as an understanding of geocoding tools. Additional information about Esri's geocoder software can be found in the document "2007 Esri Geocoder Information.pdf," which ships with ArcGIS Business Analyst 9.2. ConclusionAfter reviewing how variables are defined and the methods used in creating them and assessing the geographic data, the final component of data evaluation is comparing the results to similar data from other sources. When applying building permits to estimate housing change, the best comparison is to other estimates of housing units. Using the component formula to estimate housing with permits reported by the sample county yields the results shown in Figure 5. [Note that new mobile homes for subcounty areas are estimated from mobile home shipments reported by state, using the ratio of area mobile homes to state totals reported in Census 2000. Also, Esri's updates of housing units include private data sources that are not shown here. For more information, refer to the white paper Esri's Demographic Update Methodology, available from the Esri Web site.]
The total of 98,941 housing units estimated from local records compares to a 2005 estimate of 92,622 from the Census Bureau and 94,288 from Esri. If housing completions are substituted for building permits, then the number of new units drops to 8,857 and total housing units decrease to 98,323. Even the housing completions appear to overestimate new housing in this county, but the definitions can explain some of the differences. Most of the new housing units in this county are multifamily structures, and the county defines a structure as "completed" when half the units are available for occupancy. Adding a new data source involves more steps than just importing the data. First, the database can be compared to independent data sources to check the validity of the information. Second, the spatial component of the database must be assessed for compatibility and accuracy. Using building permit data, this article has demonstrated several data evaluation tips from Esri's data development team. For more information, contact Alan Jackson, Edmond Ting, or Lynn Wombold. About the AuthorsAlan Jackson, who currently works on the data development team as a GIS specialist, has also worked on the development of ArcSDE and ArcIMS. Before joining Esri in 1992, he worked in the petroleum industry and for the federal government. Edmond Ting has been working in the marketing information industry since 1987. He joined Esri in 2003, and his primary responsibilities include demographic estimates and forecasts as well as market segmentation. While working as a senior demographer/statistician for CACI Marketing Systems, he built the ACORN segmentation systems for the United States and Canada. Prior to working at Esri, he worked for Strategic Mapping Inc., Claritas, Capital One Financial Corp., and IXI Corp. Ting holds a master's degree in sociology from York University in Toronto, Canada. Lynn Wombold, chief demographer at Esri, manages data development, including the processing of census data; the development of unique databases such as the demographic forecasts, consumer spending, Retail MarketPlace, and Community Tapestry market segmentation system; and the acquisition and integration of third party data. She is also responsible for custom analysis and modeling projects. With more than 31 years of experience, her areas of expertise include population estimates and projections, state and local demography, census data, survey research, and consumer data. Prior to joining Esri, she worked for CACI Marketing Systems and was the senior demographer at the University of New Mexico. Wombold holds degrees in sociology, with a specialty in demographic studies from Bowling Green State University in Ohio. She has received CACI's Eagle Award for Technical Excellence and Encore Achievers. The author of numerous articles for industry publications, she frequently presents papers on demography. |