Considering the uptick in massive winter storms like the one that rolled across the US in December 2022, it’s important to be able to predict and analyze severe weather patterns. This can often be achieved with tools in ArcGIS Online and content from ArcGIS Living Atlas of the World—which includes authoritative live feeds and other content that helps you learn more about current and predicted weather conditions.
In this tip, you will learn to add weather and storm layers from Living Atlas, make changes to layer visibility to display or hide unneeded layers, use filters to further focus the scope of your weather map, and improve the map using transparency and other effects.
Make a Weather Map
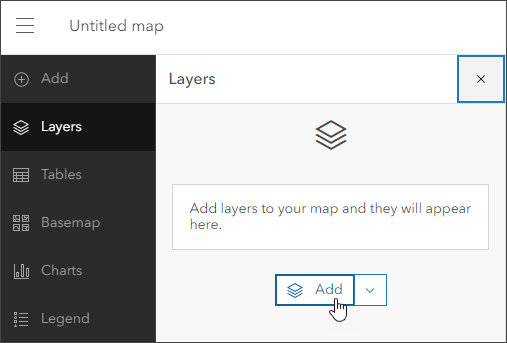
Step 1: Sign in to your ArcGIS account and open Map Viewer.
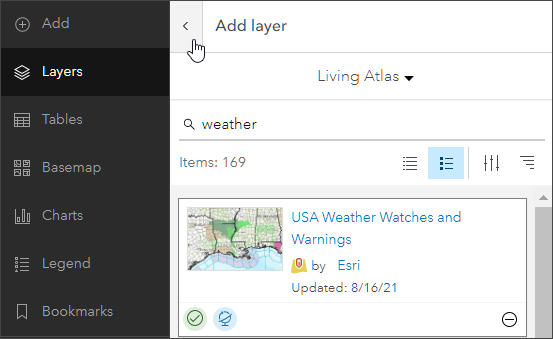
Step 2: Add a layer from the Content (dark) toolbar. To do this, open the Layers pane and click Add.
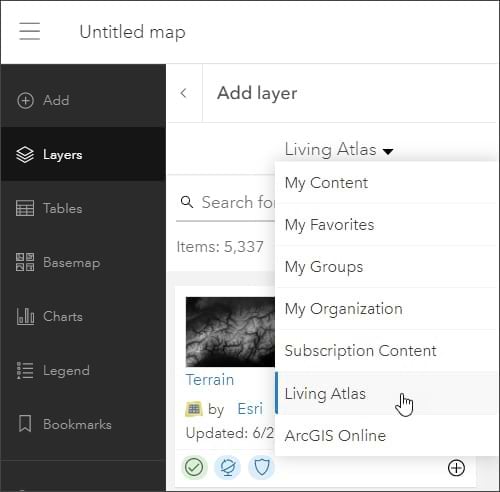
Step 3: Click My Content and choose Living Atlas from the drop-down menu.
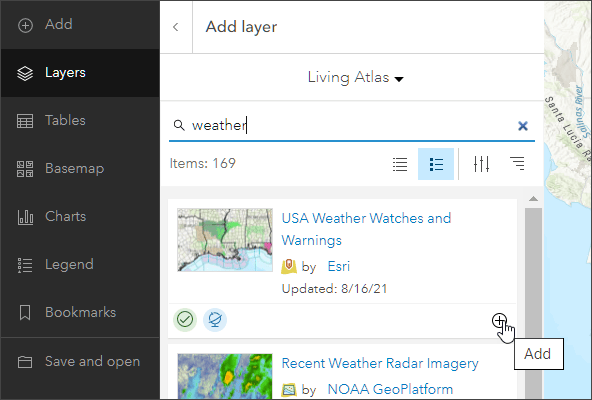
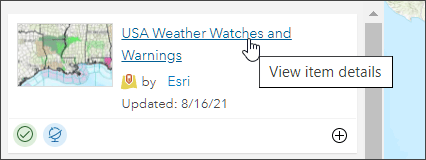
Step 4: Enter “weather” in the search box to locate the USA Weather Watches and Warnings layer. Click the Add button (+) to add it to the map.
To learn more about any layer, hover over the layer title and click View item details.
Click the View full item details button to view the item page.
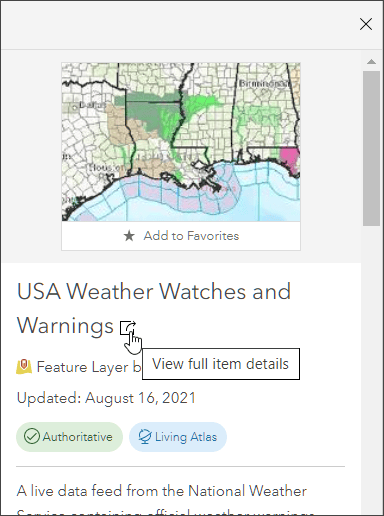
Looking at the USA Weather Watches and Warnings item details, you can learn that the layer is a live data feed from the National Weather Service containing official weather warnings, watches, and advisory statements for the United States. The layer is updated every five minutes using the Aggregated Live Feeds methodology.
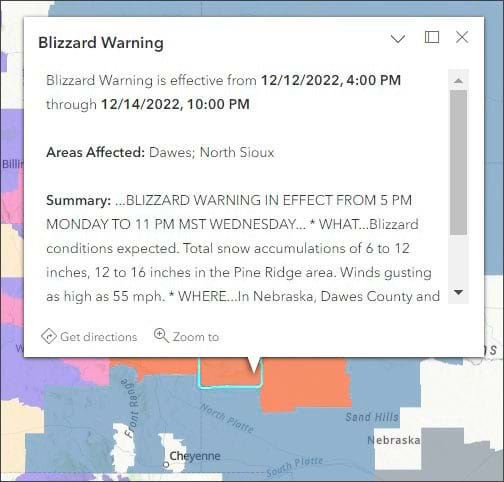
Click features on the map to learn more. You can cycle through pop-ups using the arrows at the top of the pop-up pane. The Events pop-up displays details such as type of advisory, duration of the advisory, update date and time, and a summary with a link to more information.
Step 5: Click the arrow next to Add Layer to dismiss the layer information.
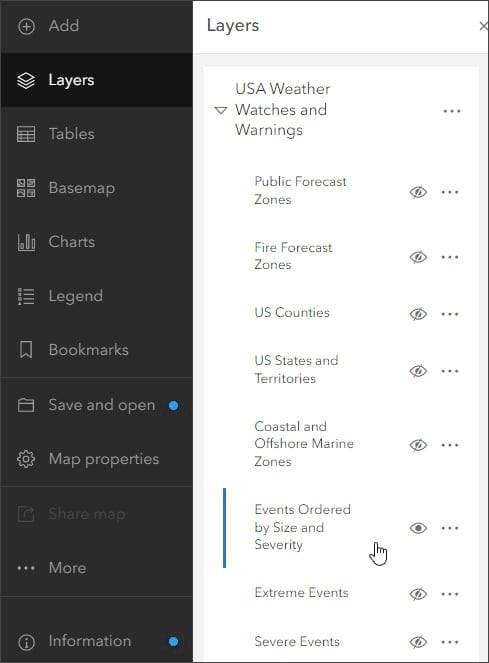
Step 6: Click on the arrow next to USA Weather Watches and Warning to view the sublayers for this layer. Now you can change the layer visibility of your weather map to focus on specific data.
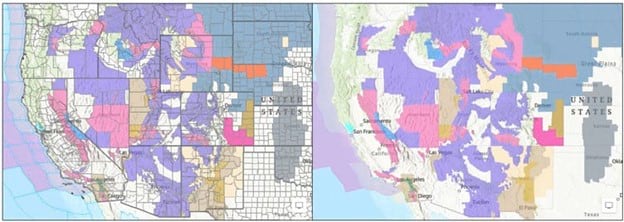
USA Weather Watches and Warnings is a group layer with 11 sublayers. Four are visible by default. In the Layers pane, you can change the visibility for layers or remove unwanted ones. To display only the Events Ordered by Size and Severity sublayer, hide the Public Forecast Zones, US States and Territories (most Living Atlas basemaps include state and territory boundaries), and Coastal and Offshore Marine Zones layers in addition to the sublayers turned off by default. Hide the highlighted sublayers shown below.
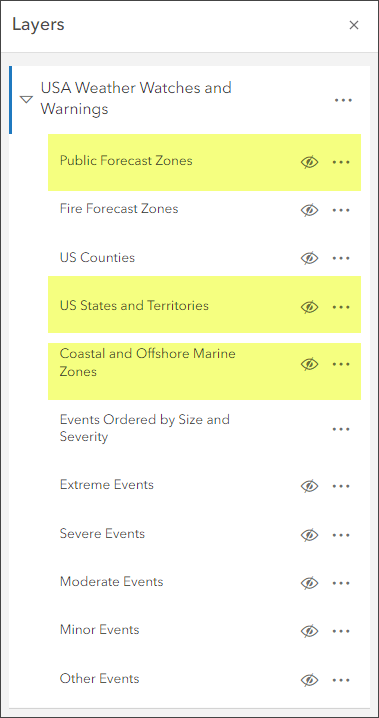
Below, the map on the left shows the default layer visibility. The map on the right hides the layers noted above.
Apply Layer Filters
You can use layer filters to limit the visibility of certain features in the map, applying focus to what’s important to you.
Step 7: View the National Weather Service watch/warning/advisory definitions. Decide which watch, warning, and advisory definitions you want to focus on. For this tip, you will create a filter to focus on those that pertain to blizzards and winter weather.
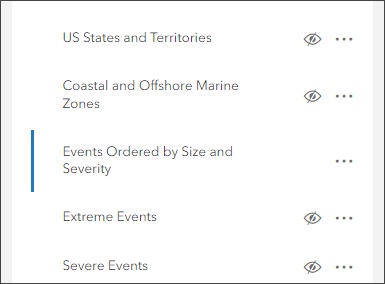
Step 8: In the Layers pane, select Events Ordered by Size and Severity. When a layer is selected, it is highlighted with a vertical blue bar.
Step 9: Click Filter in the Settings (light) toolbar on the right, and click Add expression.
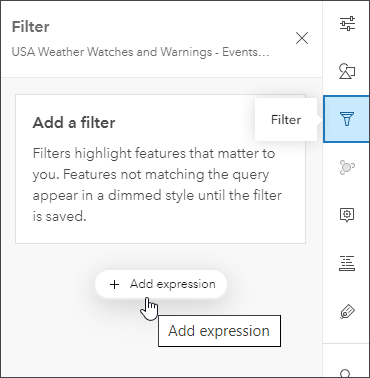
Step 10: Construct a filter expression as follows:
a. Select Type as the attribute from the list.
b. Select includes as the operator from the drop-down list.
c. Choose the desired values from the drop-down list by clicking Select Values. For this example, select Winter Weather Advisory, Winter Storm Watch, Winter Storm Warning, Blizzard Warning, and Blizzard Watch.
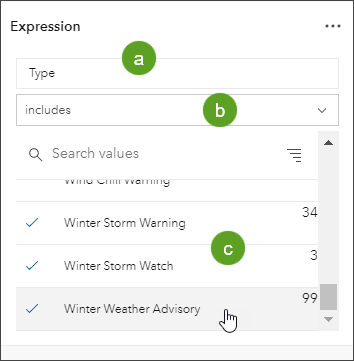
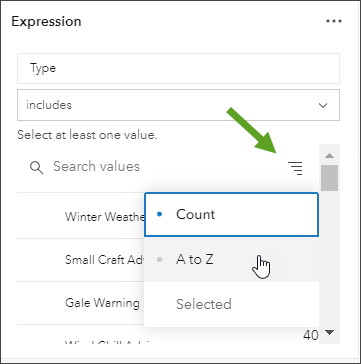
By default, attributes are listed by Count. Choose A to Z to make finding specific attributes easier.
Step 11: Click Done when all values have been added. Click Save when finished.
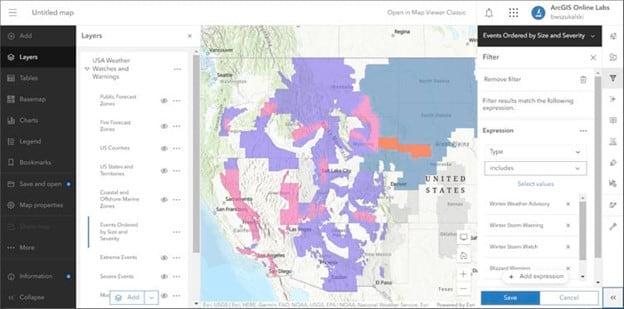
The map shown below is the result of applying the expression.
Improve the Map
You can change basemaps and layer settings to get the results you want. For example, for layers such as Weather Watches and Warnings that draw above underlying features, a basemap with reference layers that draw on top of the layer (such as Terrain with Labels) is a good choice. You can also change the weather layer settings to achieve the desired results.
Step 12: Change the basemap. Click Basemap in the Contents (dark) toolbar, and select Terrain with Labels.
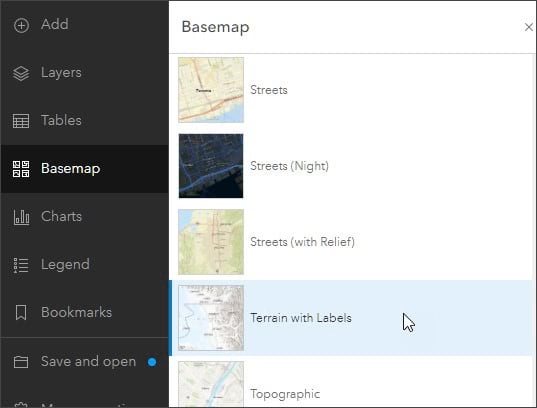
Terrain with Labels has reference layers that draw on top of all other layers. The basemap also has terrain.
Step 13: Click Layers to open the Layers pane. Select Events Ordered by Size and Severity from the USA Weather Watches and Warnings drop-down menu.
Step 14: On the Settings (light) toolbar, click Properties and scroll down in the Properties pane to Appearance. The weather events layer is set to 40% transparency by default. Set transparency to 60%.
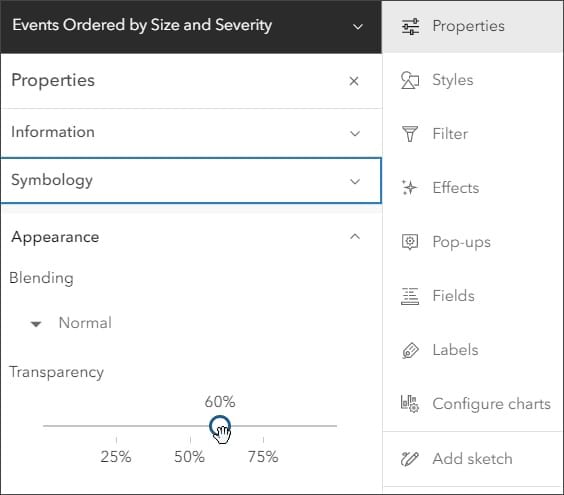
By setting the transparency, the layer saturation is also reduced.
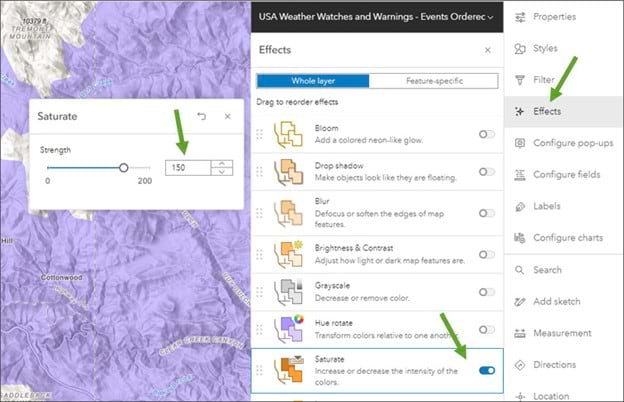
Step 15: On the Settings toolbar, click Effects. Effects can be applied to increase the saturation without affecting transparency. In the Whole layer effects, enable the Saturate effect and set the saturation strength to 150.
Step 16: You can also apply effects to basemap layers. Open the Basemap pane, open the World Hillshade basemap, and then select the World Hillshade basemap layer and adjust the Brightness & Contrast settings to dim the brightness.
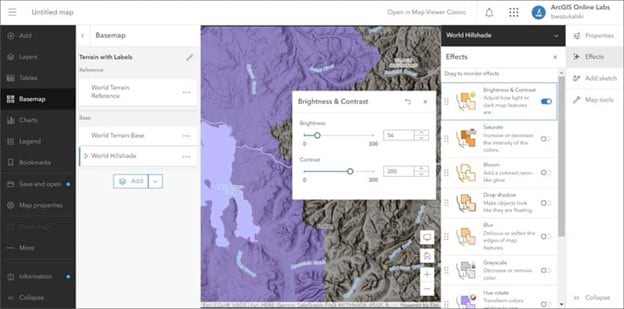
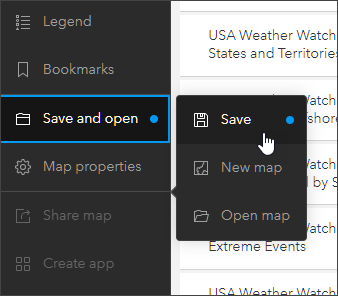
Step 17: When finished, save your map.
More Information
There are plenty of other weather-related maps, apps, and layers you can explore. For more information, see the following: