Human activities, including overfishing, ocean disposal, oil spills, the destruction of coastal ecosystems, land-based contamination, and climate change, have all altered marine habitats to the point that their numbers are declining precipitously. Fisheries around the world have been extensively exploited as well, causing much concern among scientists.
Ecosystem sustainability is essential to keeping the earth and all its inhabitants in equilibrium. But getting to that point requires substantial fieldwork, from collecting environmental samples to monitoring species’ movements, which is often very time-consuming and costly.

Two common field research methods for marine habitats are conducting catch-and-release studies in areas where people fish for pleasure and administering surveys to recreational anglers. Catch-and-release methods are very localized, though, considering that the fish must be hungry, curious enough to take the bait, and swimming underneath the watercraft. And when it comes to doing surveys, anglers can be quite selective about whom they give their fishing information to, for fear of losing their secret spots. So there’s a risk of getting dubious answers.
To properly manage fisheries, however, the federal and state governments need to take an ecosystem-based approach that addresses interactions among the physical, biological, and human components of aquatic environments. This means that resource managers need to identify quality habitats to study, as well as take into consideration the economic values that both these spaces and their inhabitants can produce.
With this goal in mind, we set out to reduce the time and effort it takes to find popular fishing locations. The idea was twofold. First, we wanted to help resource managers figure out where certain fish populations are under pressure from sport fishing. Second, we wanted to be able to show anglers where to find the specific fish species they want to catch. This information could then be used to encourage anglers to cast their lines in less popular fishing areas to reduce the strain on certain locations that are prone to overfishing. Using Tampa Bay, Florida, as our study area, we generated a model that could predict where particular fish species can be found in different seasons, as well as which boat ramps are optimal launching points for targeting them.
To start, we got more than 20 years of spatial fisheries data for Tampa Bay from the Florida Fish and Wildlife Conservation Commission (FWC). For each fish caught during various FWC studies over this period, the data showed the coordinates for where it was caught; the date it was caught; the fish’s length; and other aquatic parameters, such as water depth and temperature, associated with the catch.
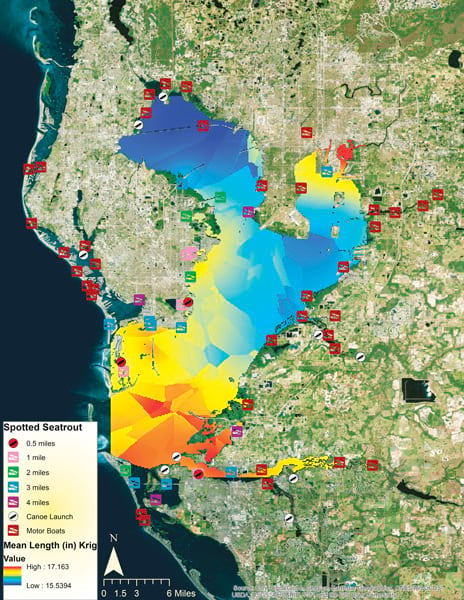
We then focused the study on 10 fish species, including red drum, sheepshead, spotted sea trout, pinfish, and black drum. The first question we wanted to answer was whether popular recreational fisheries had a random assortment of fish or if there was a distinct spatial pattern for each species’ size class. To begin the analysis, we used the Hot Spot Analysis tool in ArcMap to determine areas that have large fish in them by comparing the mean length of one species of fish at each site to the mean length for all the fish in that individual species’ dataset. We then used the Kriging tool to interpolate a raster surface that shows, more evenly, the variation in size of individual fish species throughout Tampa Bay.

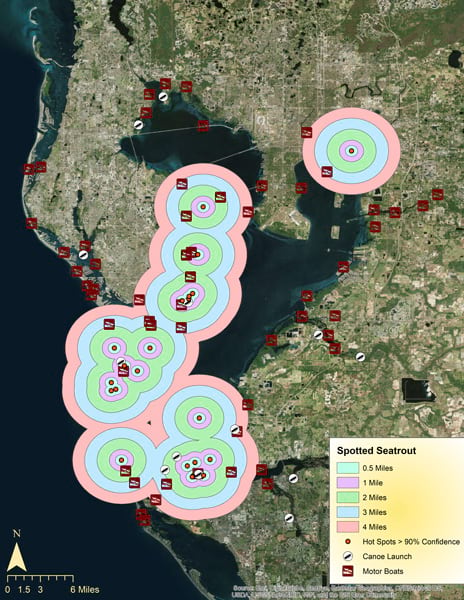
The next step was to figure out where large fish tend to congregate in relation to Tampa Bay’s boat ramps. Using the Hot Spot Analysis tool in ArcMap once again, we identified clusters of large fish that were isolated from the full dataset. We then set up buffers at various distances—from 0.5 miles to 4 miles—around the identified cluster sites and established which boat ramps intersected with them. This allowed us to see which boat launches around Tampa Bay are optimally located for fishing the 10 focus species of the study. If there are groups of these large fish close to multiple boat ramps, those clusters are likely prone to overfishing. However, if there are collections of the same (or similar) species just a little farther away, anglers could go there instead and relieve some of the ecological pressure on their preferred fishing spots.
Once the model was set up, we had to determine whether it was accurate, so we rounded up students from the University of Tampa’s Spatial Ecology Lab to visit several boat ramps in Tampa Bay that were deemed optimal for catching large fish. There, students asked anglers who were pulling their boats in from the water what types and sizes of fish they caught, how far they traveled from the boat ramp, and why they launched at that particular spot.
The completed surveys ended up corroborating the ArcMap model, showing which areas throughout Tampa Bay faced the most fishing pressure. For example, the model predicted that at the Fort Desoto boat ramp, on the north end of Madelaine Key, the main species caught would be sheepshead and spotted sea trout. The anglers surveyed at that location confirmed that 50 percent of the time they catch sheepshead, and the other 50 percent of the time they catch spotted sea trout.
These findings were a huge step in the right direction, as they indicate that using the model—which could be replicated for other aquatic environments—can reduce the amount of time and effort it takes to find key marine habitats and determine some of the human-induced pressures they face.
Currently, we are finalizing the model so that resource managers can use it to monitor species distribution and overfishing in other marine ecosystems. In addition, a small subset of anglers in Tampa Bay is already using the maps generated by the model to target their preferred fish species.


