For nearly three decades, we at the University of Texas (UT) have been working with Esri to support the intersection of GIS and water resources, particularly in the areas of hydrology and flood mapping. Recent technological advances—and their proven value in the face of Hurricane Harvey—make this a good point in time to reflect on how we got here, highlight recent developments, and share future initiatives.
The History of Flood Mapping
Esri’s engagement with the water resources community took off in the early 1990s with the introduction of digital elevation model (DEM) analysis tools for hydrology in ARC/INFO 6.1. This simplified the process of computing watershed variables for hydrologic models. By the late 1990s—challenged by duplicate efforts and a lack of interoperability between systems—our team at UT worked with Esri to organize a group of academic, industry, and government water professionals to design a universal water resources data model. Known as Arc Hydro, there are now many implementations of this data model around the world, all sharing common design properties and patterns that maintain their interoperability.
Over time, what began as a data model evolved into the de facto starter kit for nearly all ArcGIS water resources users—and it continues to progress today. In 2004, our research team created Map2Map, which computes a water surface elevation model and ultimately produces a map of flooded areas by pulling Next Generation Weather Radar (NEXRAD) rainfall data and landscape attributes into two hydrologic modeling systems: the HEC-HMS rainfall runoff model and the HEC-RAS hydraulic model. This important milestone provided a near real-time connection between measured rainfall and flood mapping. Once built, it could even be scheduled to run in an automated form. During this period, the integration of GIS with hydrologic and hydraulic modeling became more formalized. Esri and the US Army Corps of Engineers collaborated in the development of HEC-GeoHMS and HEC-GeoRAS, free ArcGIS extensions for creating model inputs and working with model outputs.
The Need for Improved River Forecasting
Despite these developments, large areas of the United States (and the world) don’t have current flood maps—and in other areas, no flood modeling studies have been done at all.
Following a series of catastrophic floods and unfortunate deaths in central Texas in recent years, the UT research group began a renewed focus on flood forecasting, particularly in areas nobody had modeled before. A large part of the initiative centered on providing information to first responders during flood events.

In 2014, we, along with the National Oceanic and Atmospheric Administration (NOAA), initiated the National Flood Interoperability Experiment (NFIE), a research collaboration involving the government, academia, and industry (including Esri) to explore and create a prototype of new approaches for national-scale flood forecasting. This resulted in NOAA’s 2016 release of the National Water Model for the United States, which combines GIS and numerical modeling tools to transform streamflow forecasts at 7,000 United States Geological Survey (USGS) stream gage locations into forecasts for 2.7 million stream reaches. Today, these forecasts are available as services in ArcGIS Online and on NOAA’s Office of Water Prediction website.
Currently, a team of researchers led by Brigham Young University’s Jim Nelson is tackling a similar initiative at a global scale. They are downscaling the European Centre for Medium-Range Weather Forecasts’ (ECMWF) global runoff forecast onto a global stream network. This will provide access to 15-day streamflow forecasts and 35-year historic flows through an easy-to-use web app.
Using traditional hydraulic modeling techniques to transform streamflow forecasts into flood depth forecasts for a nationwide system is very data- and time-intensive, so the NFIE team has been taking a new approach. Initially developed on a supercomputer, the Height Above Nearest Drainage (HAND) terrain model can now be run for the entire nation at 10-meter resolution as a single job on commercial cloud hardware thanks to the recent advances in ArcGIS—a more-than-500-times improvement in the scalability of the ArcGIS Image Server hydrology tools running in a distributed cloud computing environment. The HAND raster is computed once, then through a custom Python raster function, new runoff forecast tables are dynamically presented as time-aware image services of flood depth.
The Esri water team has been engaged in many aspects of these projects. All the Python scripts created in support of these initiatives are being rolled into the free, open-source Arc Hydro toolset to help others customize their workflows, whether they need to create a custom version of streamflow for a county or country or they want to use a high-resolution DEM to do detailed inundation mapping.
Lessons from Hurricane Harvey
In late summer 2017, as Hurricane Harvey barreled down on the US mainland, various models were predicting that the storm would bring an unprecedented amount of rainfall. But because there was a lack of accurate maps, even though forecasters knew there would be large areas with several to many feet of water, they didn’t know where the water would accumulate or when. In the end, the tropical cyclone created the largest areal rainfall quantity ever recorded for the United States, causing $125 billion in damages and resulting in more than 80 fatalities.
The devastation left in the wake of Hurricane Harvey was cause to unite the National Water Model and HAND flood mapping initiatives. Although the National Water Model was still under development and not yet an operational system, and the HAND inundation mapping technique was still a research project, the event was catastrophic enough to justify pulling in these tools to produce a regional view of the impact. More than 40,000 river miles were affected, and over 100,000 homes were flooded.
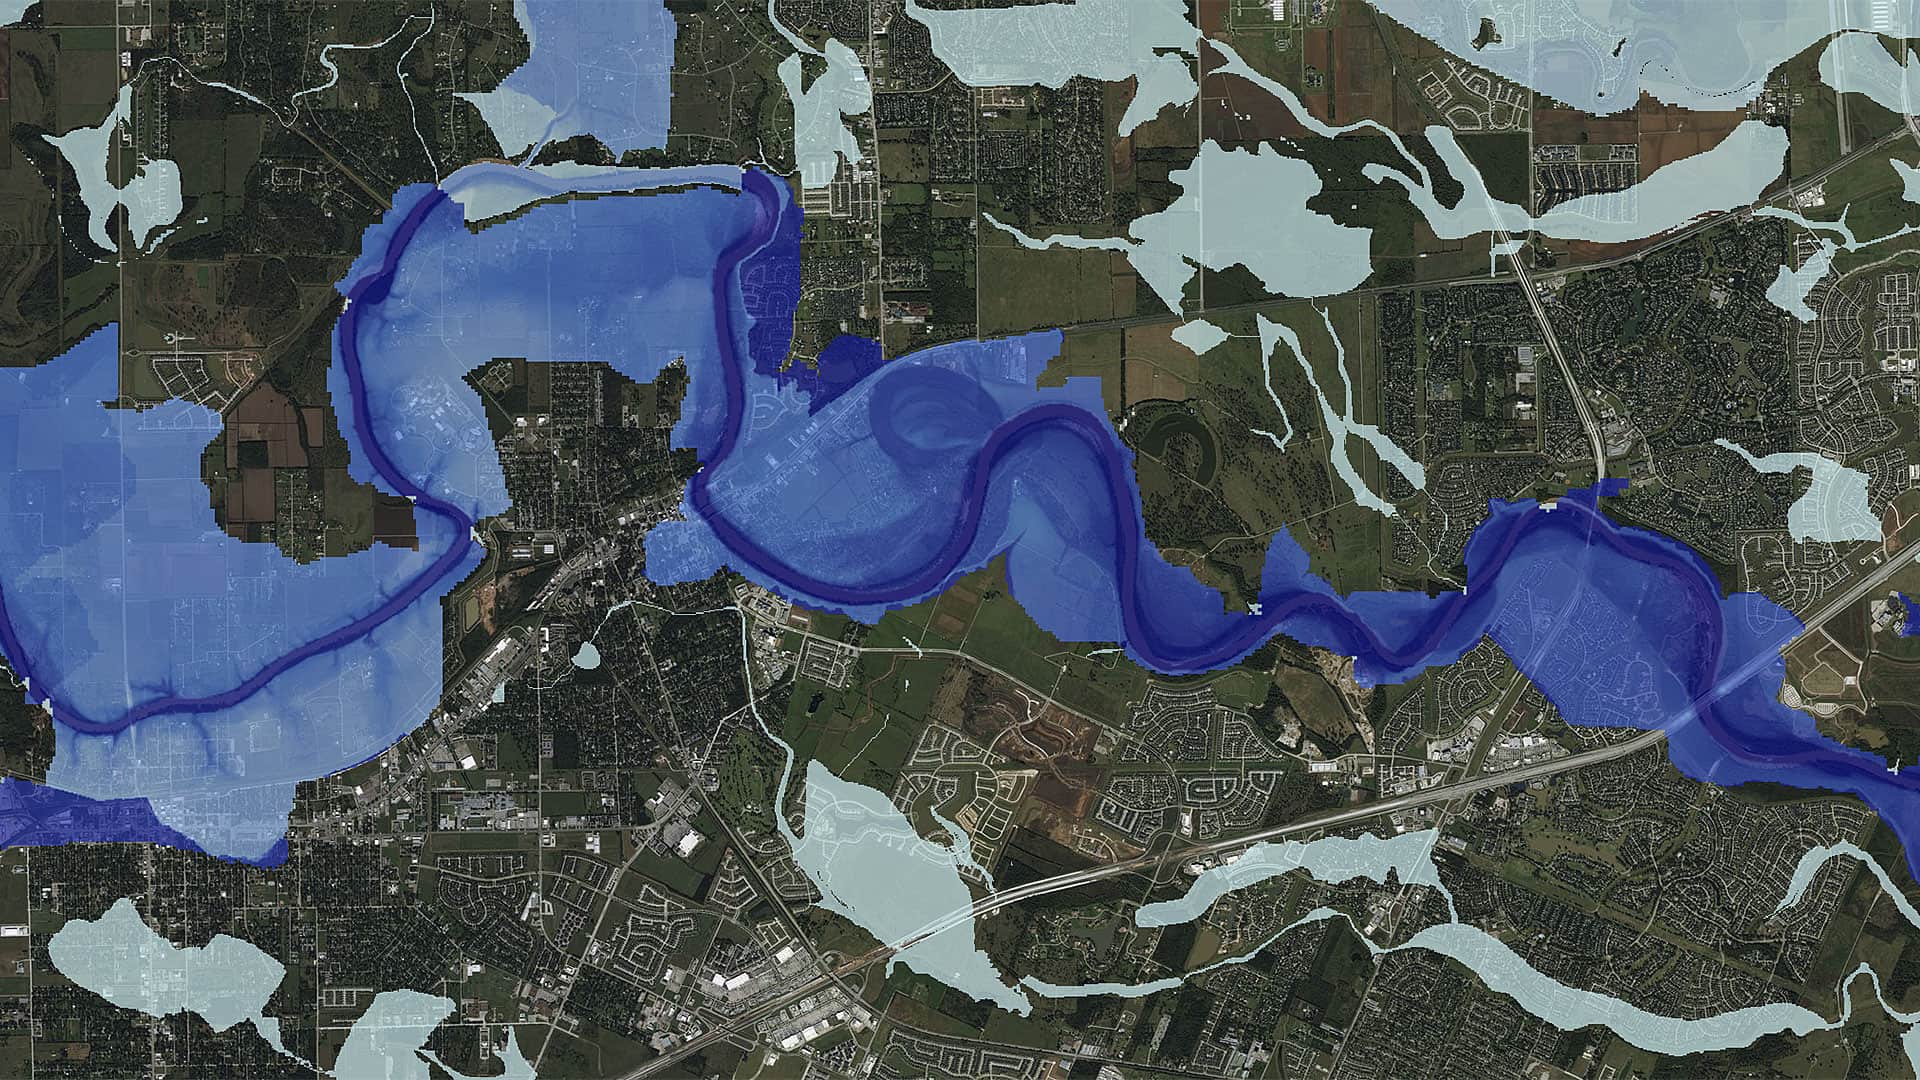
A map of the flooding over the entire area impacted by Hurricane Harvey was prepared at the Texas governor’s request. Subsequent comparison with high-water marks collected by USGS showed that the average difference between the HAND inundation mapping and the observed high-water levels was about 25 centimeters, or 10 inches. At some individual locations, however, larger positive and negative differences between observed and mapped water levels occurred. We hope that by remapping the areas using lidar data, these differences can be reduced.
The Future of Flood Mapping
This is not the end of a journey but rather a new beginning. There are already initiatives planned or in motion to further this work and increase its impact, including the following:
- Improving the numerical models to incorporate the complexities of coastal zone flooding.
- Making data improvements, like more tightly integrating controlled streamflows from dams with higher-resolution terrain for urban flooding and developing countries.
By incorporating other data, such as where people live and work, and coalescing with other modeling domains, like transportation, we can connect flood forecasting models to transportation models. This would improve evacuation planning and first responder deployment, as well as prioritize cleanup and recovery.
Imagine, in the near future, that phone-based routing apps know their users’ daily paths home from the office and can alert them to potentially flooded roads before providing them with safe routes home. We are near a time when we can know, with reasonable certainty, the future streamflow anywhere in the world several days in advance. As the accuracy of forecasting continues to improve, we are on the verge of a new era in flood mapping.