In 2014, the French government launched Nouveau Programme National de Renouvellement Urbain (NPNRU), its national program for urban renewal. The goal of this ambitious 10-year program is rehabilitating neglected urban areas throughout the country.
Occupation by the Axis powers during World War II and bombing by Allied forces caused extensive damage throughout the area. During the reconstruction efforts that began shortly after the war, large residential tower blocks and commercial buildings were quickly erected. While utilitarian in design, these buildings provided much-needed infrastructure.
Two districts, Monplaisir and Belle-Beille, were selected for NPNRU funding for a massive urban rehabilitation project. These districts are located in the Angers Loire Métropole (ALM), the metropolitan authority surrounding the city of Angers. ALM encompasses 29 municipalities and is near the confluence of the Mayenne, Sarthe, and Loire Rivers in western France.
ALM launched a project management (PM) task to manage the more than 700 rehabilitation subprojects being undertaken in these two districts that would be running in parallel or cascade. The project’s goal is to renovate residential and public facilities that have not been modernized since the rapid construction efforts after World War II. Costing 400 million euros (approximately US$450 million), this project will provide a mix of services and facilities in residential areas and bring businesses and residents closer to improve the residents’ quality of life.

The scale of this renovation is ambitious. The project requires coordinating 13 participating organizations. In the Monplaisir district, 368 buildings will be demolished and 1,470 housing units and public spaces, such as parks, will be built in their place. In Belle-Beille, 623 buildings are to be demolished and 1,318 housing units and public spaces will be built.
A key requirement of the contract was the implementation of a project monitoring system that integrated complex planning, budgetary, and GIS functionality. Additionally, the system had to be easily accessible for both city officials and the many subcontractors working on the project.
In 2018, the Egis Group, a civil engineering company based in France, won the contract for managing the project, which must be completed in 2024. “The time frame is extremely tight because those people living in the old buildings must first be relocated, then the existing buildings will be demolished, and finally the reconstruction of the new buildings can begin,” said Frédéric Jehan, head of GIS development for Egis.
“There is a vast amount of construction data that is continually being collected, reviewed, and updated for this project,” said Jehan. “Because of the need to make it widely available 24/7, we have implemented a common data environment for the system.”
The relational database used is PostgreSQL, and project and planning information is stored in Microsoft Project (MS Project). The Web GIS front end employs the portal in ArcGIS Enterprise and is used to visualize the project status. Egis is a system integrator that implements software solutions adapted to the working environments of its clients. The company tailors implementations to meet the specific data management, analysis, and presentation needs of its clients’ management teams.
MS Project was integrated into the system because it is commonly used for project management and planning. Because MS Project lacks mapping capabilities, it could not display geospatial data that would show subproject locations. A Gantt chart, included in MS Project, is the traditional planning tool used to illustrate a project schedule, but can’t show spatial overlaps that indicate possible subproject conflicts that are visible on a map.

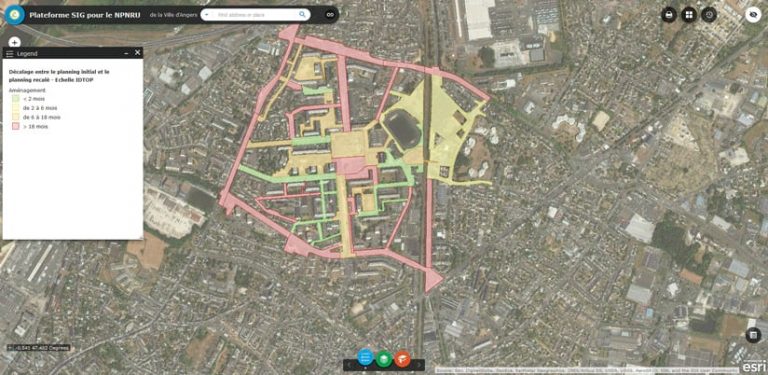
“So, the information depicted on the map allows us to modify the Gantt chart accordingly,” said Jehan. “The mapping component is a huge differentiator for us. The data from MS Project is sent to our geospatial database. This allows us to implement a time-sequenced GIS so we can visually compare the original plan in MS Project with updates as the project develops. Then we know which subprojects are ahead of schedule and which ones are delayed. By specifying each subproject on a map, we can click on them to get all of the details related to that project.”
A Python script was developed to transfer the data in MS Project to the geospatial database. Whenever a modification is made in MS Project, the script automatically saves a copy of it in a text file. Once a day, the script collects those files and integrates them into the GIS database, using unique IDs and nomenclature to adhere to the proper IT structure. The entire process is automatic.
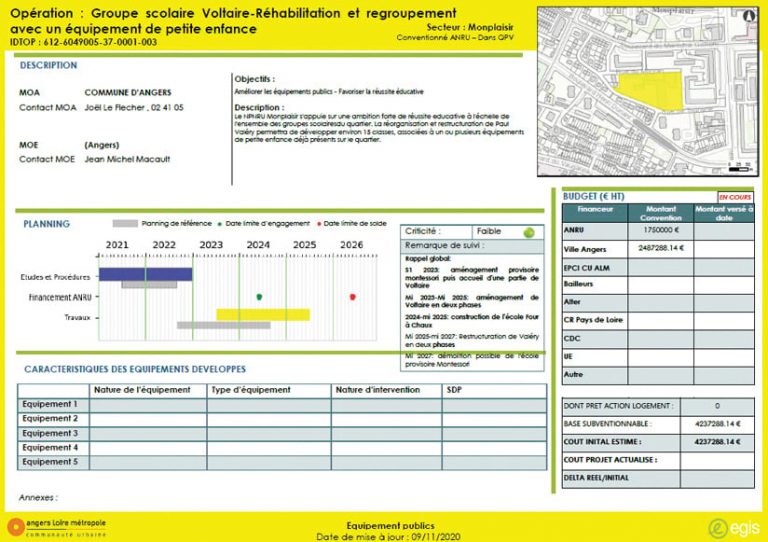
“From the GIS database, project status reports with maps are automatically generated each month for the city administration to review,” said Jehan. “The reports indicate the progress that was made on each subproject during the previous month. They include the data from MS Project, such as the budget, when a particular subproject was started, the company that is working on it, and a variety of construction details.”
Previously, this report was generated annually because it was a slow, manual process. Now, most required tasks for the project are automated through the project monitoring system.
“Centralizing the database in the system has been revolutionary for us. In the past, we had to use different software on different platforms to get the latest information on a project. Now, on a single platform, up-to-date project information is readily available and easily accessible,” said Jehan.
“In addition, there is great concern in France about reducing the carbon footprint, so that there is less impact on the environment. One way to do this is to reduce the amount of data that is stored, because server storage consumes energy. By centralizing the database, we have reduced the necessity to maintain the same data on separate systems.”
Thanks to this first, one-of-a-kind Web GIS approach, the client has identified clear benefits in implementing a collaborative Web GIS that brings multiple participants in a large-scale project under one common platform. It allows the various stakeholders to realize the advantages of having data with a high-quality data that is shared between all parties in a transparent way.
“Our management is very pleased with the outcome of the project monitoring system in Angers,” concluded Jehan, “particularly since we have won six additional projects based on the concept of the Angers platform.”

