The COVID-19 pandemic has transformed people’s lifestyles beyond measure. Because exposure to infectious respiratory droplets and aerosol particles is the primary way humans contract the disease, much of the world has spent good portions of the last year and a half social distancing, restricting outside-the-home activities, sanitizing spaces, washing hands, and wearing masks.
It will take time for life to return to normal. In the interim, the new normal will require continuing to reduce the risk of spreading COVID-19 by promoting ventilation in spaces where large numbers of people gather.

The World Health Organization (WHO) has published a road map for improving airflow inside buildings to protect against COVID-19. But in outdoor and semioutdoor areas like public transit stations, stadiums, and other open spaces, there is a limit to how much ventilation can be controlled by mechanical means alone. It is essential to examine natural airflow as well.
Airflow Analyst, an add-in for ArcGIS Pro, uses 3D urban models along with meteorological data to examine wind conditions and predict the ventilation performance of outdoor and semioutdoor spaces. In the past, this kind of fluid simulation required enormous computing resources. But now it can be done on general-use personal computers using GIS, meaning this technology is more accessible than ever and can help facility managers plan ventilation effectively.
Complex Methodologies for Measuring Ventilation Are Now Easier to Employ
The use of computational fluid dynamics (CFD) simulations is essential for evaluating ventilation performance in outdoor and semioutdoor spaces. Wind that passes through a stadium, for example, is turbulent and more complex than humans can imagine. CFD can predict convoluted airflows in places like that by solving the equations that govern fluid motion.

For most urban planners, CFD simulations are too complicated and time-consuming to put into practice. That’s where Airflow Analyst comes in. It is the first CFD software that runs in ArcGIS Pro, and it uses terrain and building data organized in GIS to predict a variety of wind-related phenomena, including ventilation performance.
Airflow Analyst lets users apply commonly available GIS data—including 3D urban models, topography, and building information modeling (BIM) data—to wind analysis. The calculation algorithm is set up specifically for doing outdoor-airflow analysis, so users without any technical knowledge of how CFD works can put together a simulation. The software performs all the operations needed for a wind simulation exercise, from setting up the calculations to visualizing the results on a map. Thus, users who are familiar with ArcGIS technology can learn how to do a wind simulation in a short amount of time.
The turbulence model that Airflow Analyst applies is called the Large Eddy Simulation (LES), and its precision at predicting airflow has been verified by wind tunnel experiments. While LES typically requires a lot of computational time and power, Airflow Analyst uses multicore central processing units (CPUs) or graphics processing units (GPUs) to produce results in a reasonable amount of time—several hours—on personal computers. This opens up this kind of important analysis to a whole host of new users who need to do things like plan human traffic in public spaces, visualize strong urban winds, or predict the extent of toxic gas diffusion due to potential chemical accidents.

A Case Study for Measuring and Predicting Ventilation
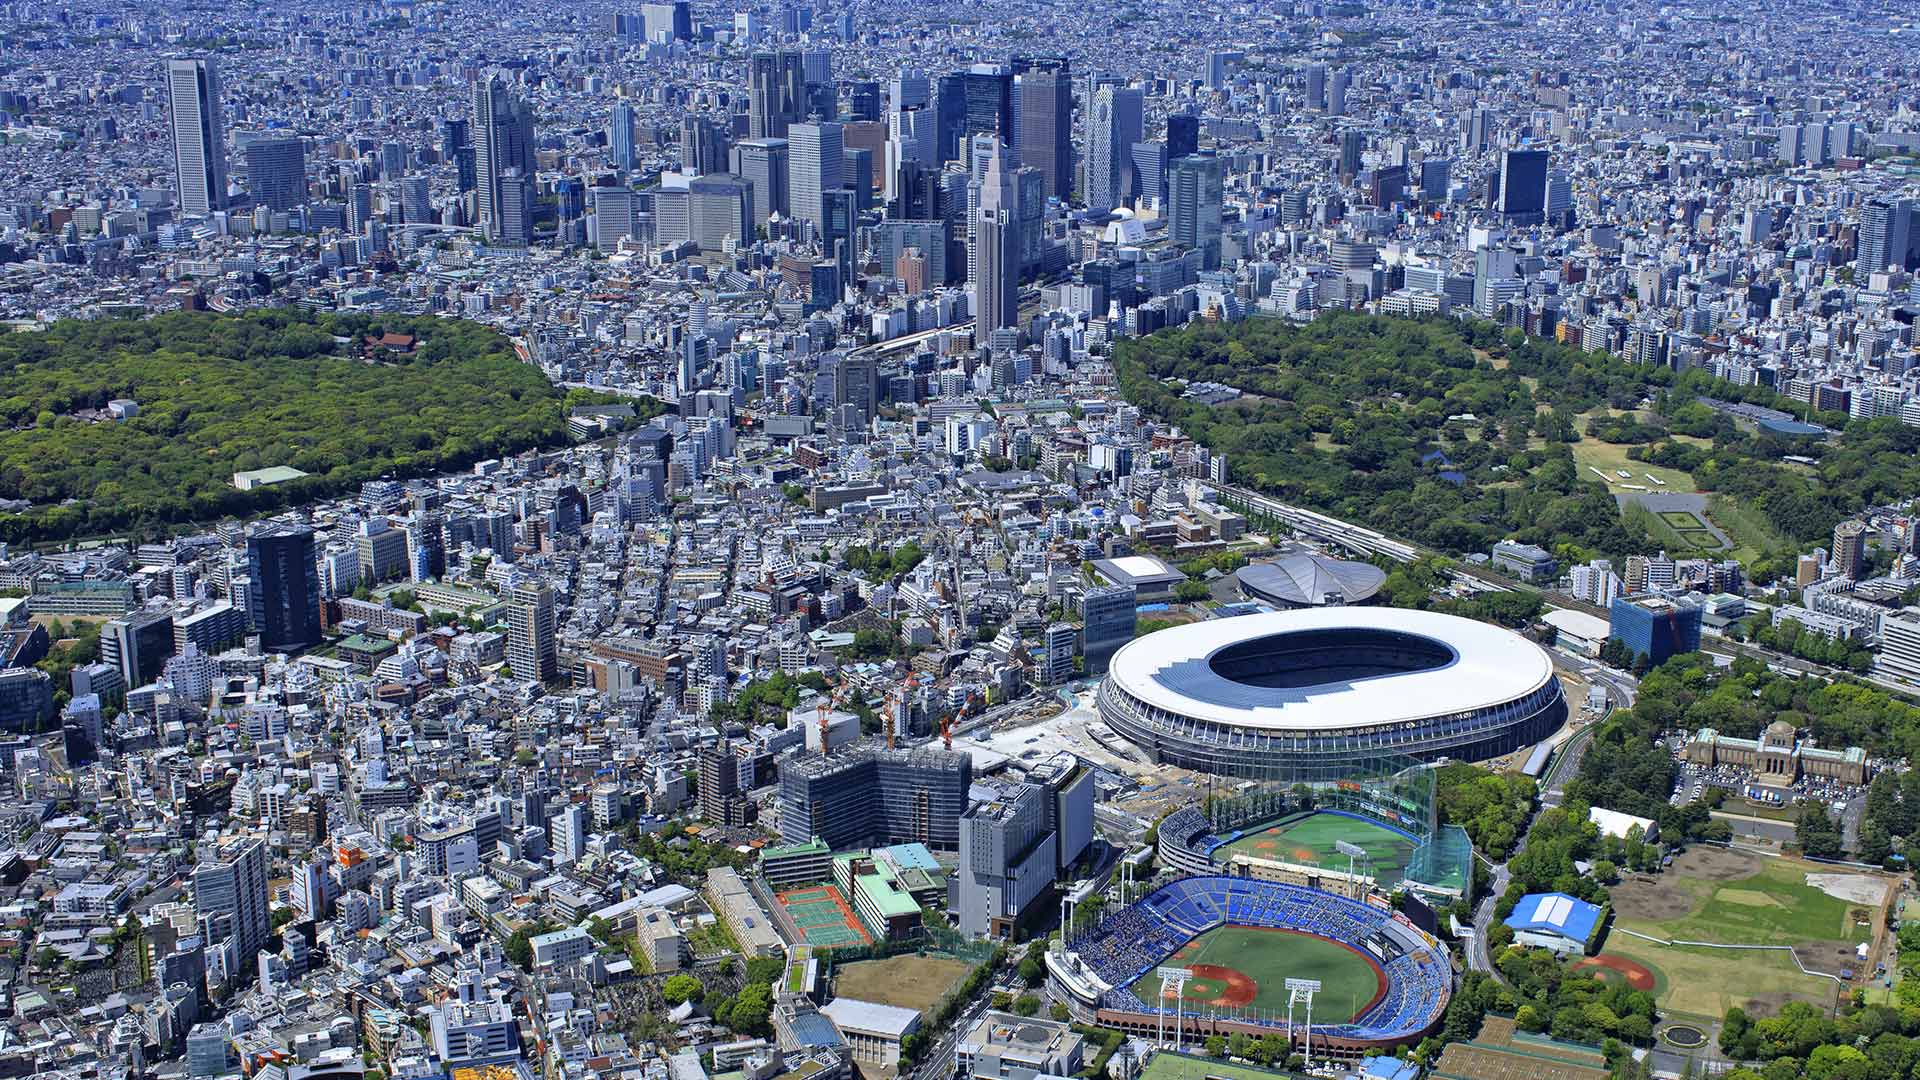
As of press time, the 2020 Olympics in Tokyo, Japan, which were postponed to 2021, will be the first major international event to take place since the outbreak of COVID-19. The main venue, Japan’s new National Stadium, has good ventilation, thanks to a gap between the stands and the roof that draws airflow into the stadium from outside. The architects who designed the stadium introduced this feature to mitigate the summer’s hot and humid thermal environment. But is it enough to prevent the spread of COVID-19?
To explore this, we used Airflow Analyst to simulate wind conditions inside the stadium so that we could see how much ventilation it would get from the natural wind that flows through Tokyo. Using AW3D—commercially available 3D map data—we reproduced the buildings and trees throughout the city. To replicate National Stadium’s complex shape, we created a 3D CAD model based on drawings of the stadium and made it a multipatch feature in ArcGIS Pro.
Next, we set a calculation area of about 1.3 square kilometers that centered on the stadium. We then set the grid spacing around the stadium to within 1 meter to reproduce the structure’s shape in even more detail. The total number of computational grid points was about 11.1 million, making this a relatively large-scale wind simulation.

We were able to simulate and visualize the wind that flows in and out of the stadium via its eaves and holes in the ceiling. It turns out that wind takes a tangled path through the interior of the stadium. To ensure that we were capturing data on how aerosols—like those that emanate from people’s mouths—fill space, spread out, and then disappear, we placed a virtual tracer gas inside the stadium model as well to observe its concentration over time.
This simulation found that all the air inside the stadium is replaced in about 13 minutes when a northerly wind with an annual average wind speed of 3 meters per second—which is common in Tokyo—blows outside the stadium. This means that the stadium gets new air approximately 4.6 times per hour. Hence, the structure benefits from a decent amount of ventilation that occurs naturally. Of course, whether this amount of ventilation is sufficient to prevent the spread of COVID-19 needs to be evaluated based on the number of people and types of activities happening in the stadium.
This case study is based solely on a northerly wind, but wind direction and speed change constantly throughout the day. So the results for only one wind direction are not adequate for evaluating National Stadium’s full natural ventilation. To get a more complete picture of its ventilation capabilities and even estimate natural ventilation conditions in real time, it would be useful to combine the results of simulations done for 16 wind directions with real-time wind observation data or weather forecast data. This information would help facility managers come up with a comprehensive plan for ensuring proper ventilation in National Stadium during the Olympics and for any other events that take place there.

New Ways to Create Safety and Comfort in Urban Spaces
In cities around the world, detailed 3D digital maps are yielding digital twins of urban areas that can help immensely with city and event planning—especially as communities begin to emerge from the COVID-19 pandemic and enter a new normal. What’s more, integrating geospatial infrastructure with Internet of Things (IoT) sensors, which measure everything from temperature to wind speed, can foster deeper understanding and better management of built environments.
By combining urban data with wind simulation technology specifically, urban planners can help create safety and comfort in densely populated areas in multiple ways including the following:
- Bringing fresh air into a city to reduce heat islands
- Making the pedestrian experience easier by analyzing how strong winds whip around high-rise buildings
- Evaluating the wind loads that structures can handle during heavy storms
- Introducing efficient natural ventilation in and around buildings
In this digital transformation that is moving through the world, being able to decipher the wind environment in various areas will provide valuable solutions for urban planning.