Energy consumption is projected to increase 56 percent by 2040, and fossil fuels are expected to provide almost 80 percent of the world’s energy during that time, according to the US Energy Information Administration.
With ice melt in the Arctic opening up navigable waters for longer periods each year, the region offers increasing opportunities for business ventures in the oil and gas industries and shipping. The Arctic has substantial hydrocarbon reserves. Traversing its waters would also yield faster shipping routes. But the area is subject to harsh and unpredictable weather and has a unique ecosystem. So any development there must be analyzed for risks and vulnerabilities while safeguarding life, property, and the environment.

That is why Norway-based DNV GL—a leading certification society and technical adviser for the maritime, oil, and gas industries—has developed The Arctic Risk Map to help businesses assess the viability of offshore or marine activities in the region.
“We created The Arctic Risk Map to provide an unbiased picture of the Arctic,” said DNV GL principal environmental risk specialist Øivin Aarnes, who developed the map. He described the map as “an open platform to be able to communicate risks in the industry and collaborate on development.”
Built on Esri technology, the web-based app presents an array of complex information in an accessible format.
Restrictions in the Arctic
The map details the potential limitations of future Arctic activities, such as development and transport.
Data in The Arctic Risk Map includes the seasonal distribution of ice, meteorological and oceanographic conditions, sea ice concentrations, biological assets, shipping traffic, and oil and gas resources. This scientific data comes from numerous predictive climate and oceanographic models from organizations such as the National Oceanic and Atmospheric Administration (NOAA), the European Union’s COPERNICUS program, and the Computational and Information Systems Laboratory (CISL) of the National Center for Atmospheric Research (NCAR).
DNV GL hosts the data in ArcGIS for Server as map layers and services. The risk map, then, is the freely available portal through which people can access all the information in one place.
“We wanted [the portal] to be open so anyone could go in there and try to answer the questions they had themselves,” said Aarnes.
By integrating this information with GIS, The Arctic Risk Map identifies the drivers of risk—low temperatures, storms, snow, ice, darkness, ocean depth, wildlife, and remote places with no search-and-rescue facilities—and makes it easy for people to visualize how these vary in different areas and seasons. Users can explore the entire Arctic or select a particular region, such as the Kara Sea, the Laptev Sea, or the Barents Sea. The app also includes a time slider that lets viewers observe what changes occur from January through December.
“We’ve taken one year in the Arctic…to see how conditions change over the year, month by month,” described Aarnes. “For instance, we made a map showing where marine icing, or [superstructure] icing, toward ships is more likely probable than in other regions. Icing on ships is due to low temperatures, freezing and strong winds, and rough seas. So we needed to join data on low temperatures and strong winds over different seasons.”
Users can also combine the map’s data layers with their organization’s own data to make even more precise decisions about risk. This allows petroleum companies to minimize the impacts of their industrial activities, for example, and enables conservation organizations to evaluate ecologically sensitive areas.
Gauging Safety and Operability
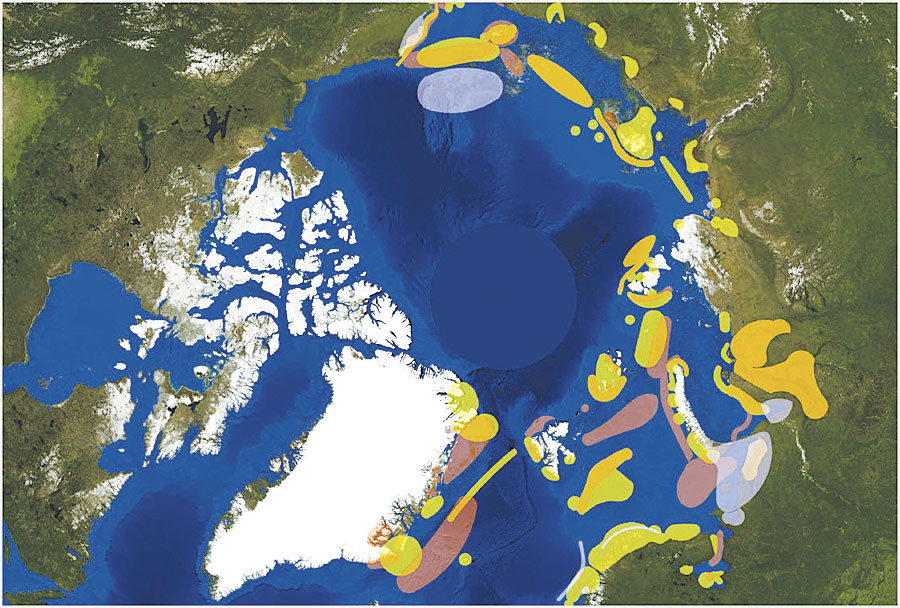
Sea ice covers large parts of the Arctic Ocean during wintertime and retreats to the center of the Arctic during summertime, unveiling channels and coastlines to open water. The Arctic Risk Map makes it easy for businesses to see seasonal and spatial variations of ice throughout the year and assess safety and operability in the region.
This information helps energy companies schedule exploration and production by providing a basis for deciding when and where it is feasible to work in the Arctic. The map also features data on extreme temperatures, which is especially important to engineers as they design oil rigs and other structural assets to withstand the region’s harsh climate.
. This data is from August 2012.")
In addition, the map service shows areas that should be avoided, which not only helps reduce environmental risks from oil spills but also helps shipping companies analyze traffic separation schemes, plan traffic lanes, and set up separation zones. This reduces the likelihood of shipping collisions in areas where the repercussions would be considerable.
An Environmental Vulnerability Index
As shorelines and channels acquire less ice, Arctic animals become more vulnerable to various ventures that encroach on their territories. Walrus, polar bears, seals, belugas, and narwhals are all Arctic dwellers—along with many other species that are threatened or on the verge of becoming threatened because of changes to their environment.
The Arctic Risk Map includes data on where fish, mammals, and seabirds breed, feed, live, and migrate. The map is broken into 17 Large Marine Ecosystems (LMEs), a decades-old concept that the Arctic Council adopted to encourage an ecosystem-based approach to management in the region. The Arctic Risk Map‘s environmental vulnerability index combines wildlife data with a map of the LMEs to let users see how external factors, such as oil spills, would affect these species and their habitats. It also shows where shipping lanes and wildlife habitats increasingly overlap.
Mapping these sensitive areas provides a geospatial guideline for planning hydrocarbon development and routing marine transit. But, as Aarnes pointed out, the data on marine species—especially the mammals and birds—needs to get more specific.
“The Large Marine Ecosystems are kind of [a] recognized and acknowledged way of separating regions in the Arctic,” said Aarnes. But he feels that dividing the Arctic into smaller subsections would yield greater detail.
With more comprehensive information about species’ migratory patterns, food preferences, and habitat changes due to shrinking ice levels, businesses such as tourism, fisheries, hydrocarbon development, and shipping will be less likely to come into conflict with the Arctic’s ecosystems.
“We wanted to also stimulate a discussion on how we can better manage the Arctic,” said Aarnes.
And that appears to be happening, with working groups such as the Conservation of Arctic Flora and Fauna interested in getting more environmental data into The Arctic Risk Map.
Preserving a Unique Ecosystem
The Arctic is not a uniform environment. Environmental risk changes from place to place and season to season based on weather and climatic conditions, shifting wildlife habitats, and human activity.
With its aggregated spatial and seasonal indices, The Arctic Risk Map helps organizations operating in the Arctic plan activities, schedule events, and engineer structures in ways that improve safety and reduce environmental risk in this unique ecosystem.
DNV GL also wants to open up the data behind the map—including all the scientific information and the rasters—to anyone via ArcGIS Online.
“We wanted to raise some awareness with this map,” said Aarnes. “We’re looking into now porting these services into ArcGIS Online so we can open up the data for others, for the public to use.”
And with that, the conversation will only expand.