Communities nationwide highly value active lifestyles. Athletic fields provide critical quality of life infrastructure. Despite the demand for fields, there is no nationally accepted standard for athletic field provisioning in this country. This situation leads to lots of questions. How does an agency determine the number of fields it should provide? Are sufficient fields currently available? Are these fields properly distributed? Where are the best places to add new fields within a community?
A study conducted by the authors for Stafford County, Virginia, utilized GIS analysis and public input to determine current demand and capacity for baseball and softball diamonds in Stafford County, Virginia. In this study, ArcGIS was used to map the locations of ball fields and analyze access throughout the county. All data management, mapping, and analysis were performed within ArcGIS for Desktop or ArcGIS Online without the need to export, import, or join to other applications. This analysis allowed planners to decide which ball fields should be improved or where ball fields should be added based on the density of a target population and the quality and distribution of existing fields.
The study area included most of Stafford County, a rapidly growing area of Virginia near Washington, DC, but excluded the Marine Corps Base Quantico in the northern part of the county. Jaime Porter, director of Stafford County Parks, Recreation and Community Facilities, noted that even though demand for diamonds was high and many had waiting lists, the county didn’t know how many more fields were needed or where they should be sited, but “We knew we wouldn’t have many opportunities to get it right,” he said.
Feedback from focus groups, stakeholders, and public meeting attendees, as well as staff, was used to gauge public demand for playing fields and existing field availability in Stafford County. Any fields that were planned and had been funded for construction at the time of the analysis were considered part of the current inventory. Since school-age children were believed to be the primary users of ball fields in Stafford County, all demographic analysis was based on a 5–19 age group.
GIS was a key tool in the study. The first step was to identify all baseball and softball diamonds owned or maintained by Stafford County Parks. Though the majority of these ball fields are located in county-owned parks, some public school fields were also considered. A total of 45 ball fields were identified and located by using aerial photographs of the county available from World Imagery on ArcGIS Online. [ArcGIS for Desktop comes with an ArcGIS Online subscription.] Existing lists provided by project partners and the knowledge and expertise of park agency staff also provided ballpark locations.
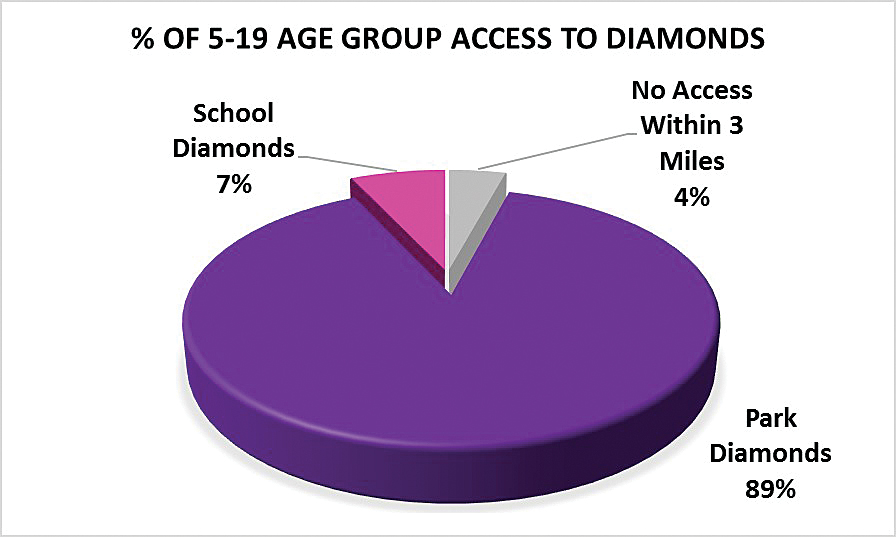
Initial GIS analysis using ArcGIS and Esri Business Analyst demographics showed excellent distribution and location of these ball fields. Data enrichment revealed that 96 percent of the 5–19 age group has access to at least one diamond within three miles of home.
Next, each of the ball fields was evaluated. The evaluation team developed a scoring system to assess the value of each ball field by examining various aspects of field quality and desirability such as

- Overall field quality
- Turf quality
- Infield condition
- Backstop condition
- Dugout
- Field fencing
- Warm-up area/Batting cage
- Irrigation
- Field lighting
- Bleachers
- Team storage
- Scoreboard
- Utilities
Scoring and analysis for this project were based on a proprietary methodology called the Geo-Referenced Amenities Standards Program (GRASP), developed by Design Concepts CLA, Inc., and Greenplay LLC.

Additional assets, such as the availability of restrooms, parking, security lighting, maintenance storage, drinking water, concessions, and family amenities, were identified for existing fields. Even though they do not directly affect play, these amenities make a ball field more inviting and comfortable. The presence of these amenities increases the value of a field, especially if the amenities are of high quality.
Scores for every ball field were entered into a geodatabase on-site using a tablet. These scores were used to calculate numerical values for the ball fields, which were then ranked and compared based on the value they provide to the community.
Scores were assigned to a buffer around each ball field so that a heat map could be created that showed the cumulative value of all ball fields within three miles of any location in the county. Three miles was a distance chosen because it approximates a 20-minute-or-less drive.
The resultant data allowed a team of GIS analysts to paint a picture that showed ball field access for any location in the Stafford County study area. Values ranged from a low of 0 (no ball fields within three miles) to a high of nearly 700 (multiple, high-scoring facilities within three miles).
The final analysis accounted for population density by census tract and calculated an average value per acre based on the population of the 5–19 age group. This analysis highlighted two types of areas. Areas with lower field values and higher youth populations were isolated within Stafford County as target areas for improving existing ball fields or adding new ones. This analysis provided county staff with clear answers for use in their future planning efforts.

Most important, this study had a real-world impact. Despite a tight budget, GIS-based analysis was used to justify and secure additional funding needed for ball field improvements. A partnership agreement is also in the works with Stafford County Public Schools to utilize school ball fields for county programming. In addition, the final report provides peace of mind for decision makers.
“Prioritizing projects and their locations based on the data collected and the results of the study, we are now confident in our investment choices knowing we are addressing actual needs,” said Porter. “We found out that we didn’t need new parks necessarily. We needed to enhance and build out current parks with the required amenities to address current and long- term capacity.”
As the public sector slowly recovers from the recent recession, those choices ensure that the limited budget can be used in ways that best serve the local community. This project highlights the value of GIS analysis in affecting change not simply in infrastructure but in the quality of life for its residents so that everyone comes out a winner.
For more information, contact David Peterson at 303-664-5301, ext. 338, or Carter Marshall at 303-664-5301, ext. 309.
About the Authors
The authors have used Esri products for more than 10 years to perform a variety of geospatial analyses of communities related to parks, recreation, and public health. Dave Peterson, PLA, is the director of Specialized Planning at Design Concepts CLA, Inc. His work focuses on park and recreation master planning throughout the United States. Carter Marshall is a land planner and GIS specialist at Design Concepts CLA, Inc.