Managing Meters Gets Faster with Workforce for ArcGIS

As part of its distinct multiutility model—delivering water, wastewater, natural gas, and electricity services—Utilities Kingston provides safe and reliable gas services to nearly 15,000 customers in Kingston, Ontario, Canada. The company routinely inspects customer appliances and related infrastructure and replaces out-of-date gas meters with upgraded ones.
Recently, Utilities Kingston switched from a paper process to a mobile GIS solution for gas meter inspections and replacements. Using Workforce for ArcGIS, a location-based app from Esri designed to improve coordination and teamwork, the utility was able to complete more than 60 percent of its meter inspections and replacements within four months. The teams also collected key data not previously available—such as unique meter IDs and information on meters that serve multiple addresses—which helped the utility integrate its meter data with other information systems and better determine how meter work would affect gas services in the vicinity.
“We hired eight employees on contract to get 5,300 gas and water meter changes done within six to eight months,” explained Jordan Rogers, a systems analyst at the City of Kingston who, at the time, was a GIS technician at Utilities Kingston. “We created all 5,300 assignments in Workforce for ArcGIS and then categorized [them] based on the type of work that needed to be done. Within four months, we had already completed 3,100 assignments.”
From Paper to Mobile
In the past, Utilities Kingston relied on paper forms to inspect meters and change them out. Fieldworkers would complete inspection sheets and meter order forms on paper and then manually submit them to multiple clerks in several departments, who input the information into the utility’s customer information system and several spreadsheets used to track projects and assets. A summary of the data would then be sent to the customer service team to ensure that this department had the most accurate information for customer calls.
“That’s a lot of traveling around for a piece of paper to do,” Rogers said. “We knew we could set something up using real-time data streams.”
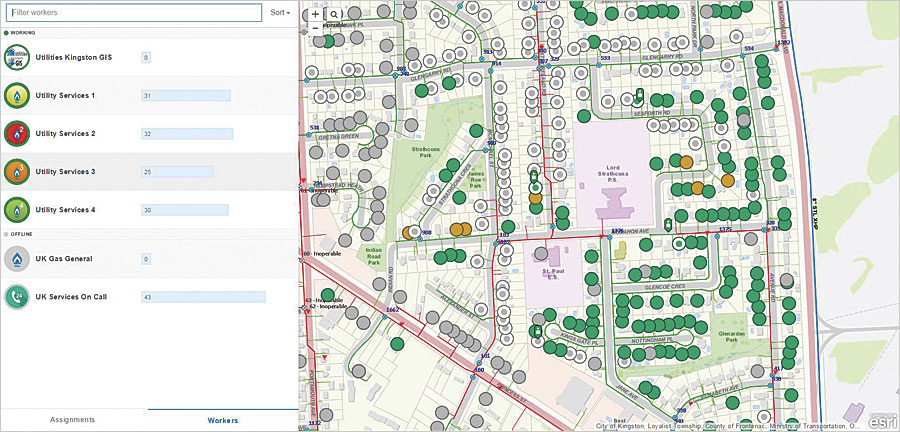
To update this process, the metering and communication departments—in conjunction with the service and gas operations division—first created a Microsoft Excel spreadsheet with details for all 5,300 meters that needed to be replaced within the company’s distribution area. The GIS group then used Workforce to lay out the spreadsheet data geographically. Seeing everything on a map allowed the natural gas team to quickly identify concentrations of work that needed to be done and focus their efforts on specific geographic areas each day.
“If we replaced meters in alphabetical order, for example, we would have had workers running all over the city,” Rogers said. “The gas team used Workforce to help prioritize their schedule. Employees—from management to field staff—were able to see the strong benefit of a system that helps organize complex workflows and make them simple.”

The Benefits of Real Time
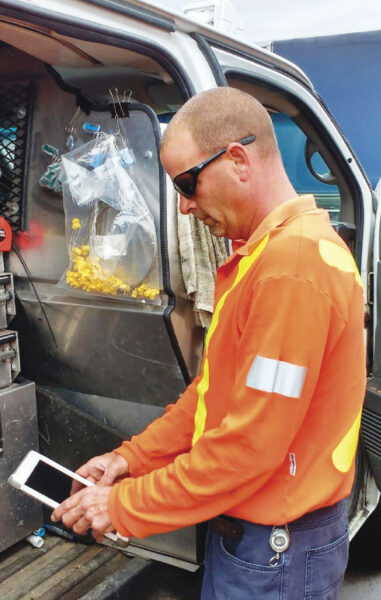
Here’s how the process works now. A scheduler for the Workforce project designates dates and priorities for each meter inspection or replacement work order. The eight employees assigned to the job work in teams of two, traveling to assignments in work vans. Every day, the teams open the Workforce app on the tablet computers they bring with them to see what they have to do and where they have go.
At each assigned stop, the fieldworkers use Workforce to directly access information on each assignment and collect relevant data using Collector for ArcGIS. Within the Workforce app, they can add important notes, such as when the gas was turned off and whether appliances need to be relit. This information is available in real time to office staff, who can now more quickly create status reports, manage customer inquiries, and plan future inspections.
“Workforce is allowing us to collect important information [that was] not available in the field and will now be available for use by our service technicians,” said Karen Santucci, the company’s manager of utilities services and gas operations. “This is the big selling point for our field staff.”
Now, more employees have access to information that was previously only available to some, and data is presented in a user-friendly format that makes it easier to perform analysis. Whole processes don’t stop just because a piece of paper got stuck on someone’s desk, and status reports and analyses are always up-to-date. With real-time data coming in, dispatchers can see where crews are and how much work they have left to do in a given day to determine if jobs need to be reassigned. It also helps the customer service department answer inquiries as quickly and thoroughly as possible.
With more departments using real-time meter data in new ways, organizational transparency at Utilities Kingston only continues to improve.

