Seven New Ways to Tell a Story in ArcGIS StoryMaps
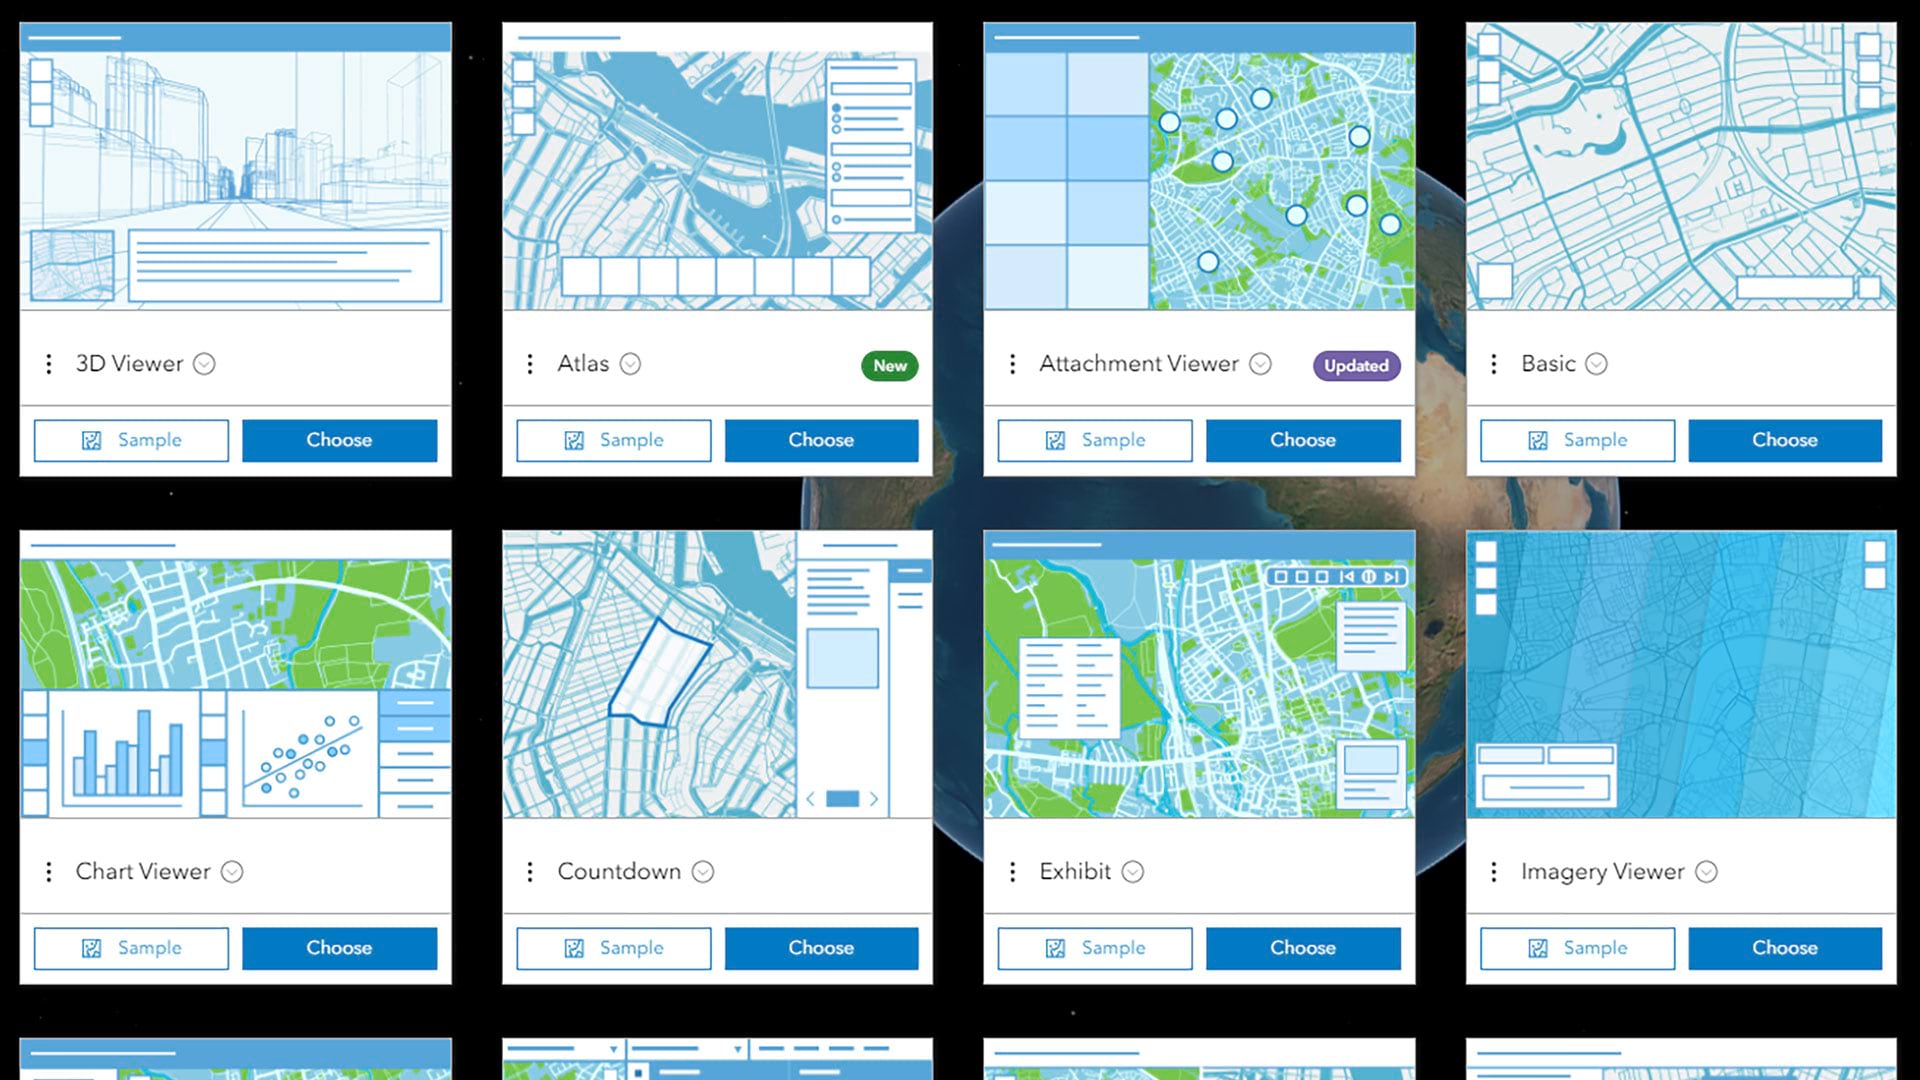
The product team has recently added templates, the ability to create interactive charts, advanced embedding capabilities, and more.
The product team has recently added templates, the ability to create interactive charts, advanced embedding capabilities, and more.
Data and GIS can be used to map solutions’ relative suitability, impacts in different locations, feasibility, and costs.
StoryScape is a digital magazine that highlights exceptional stories built with ArcGIS content, along with the storytellers behind them.
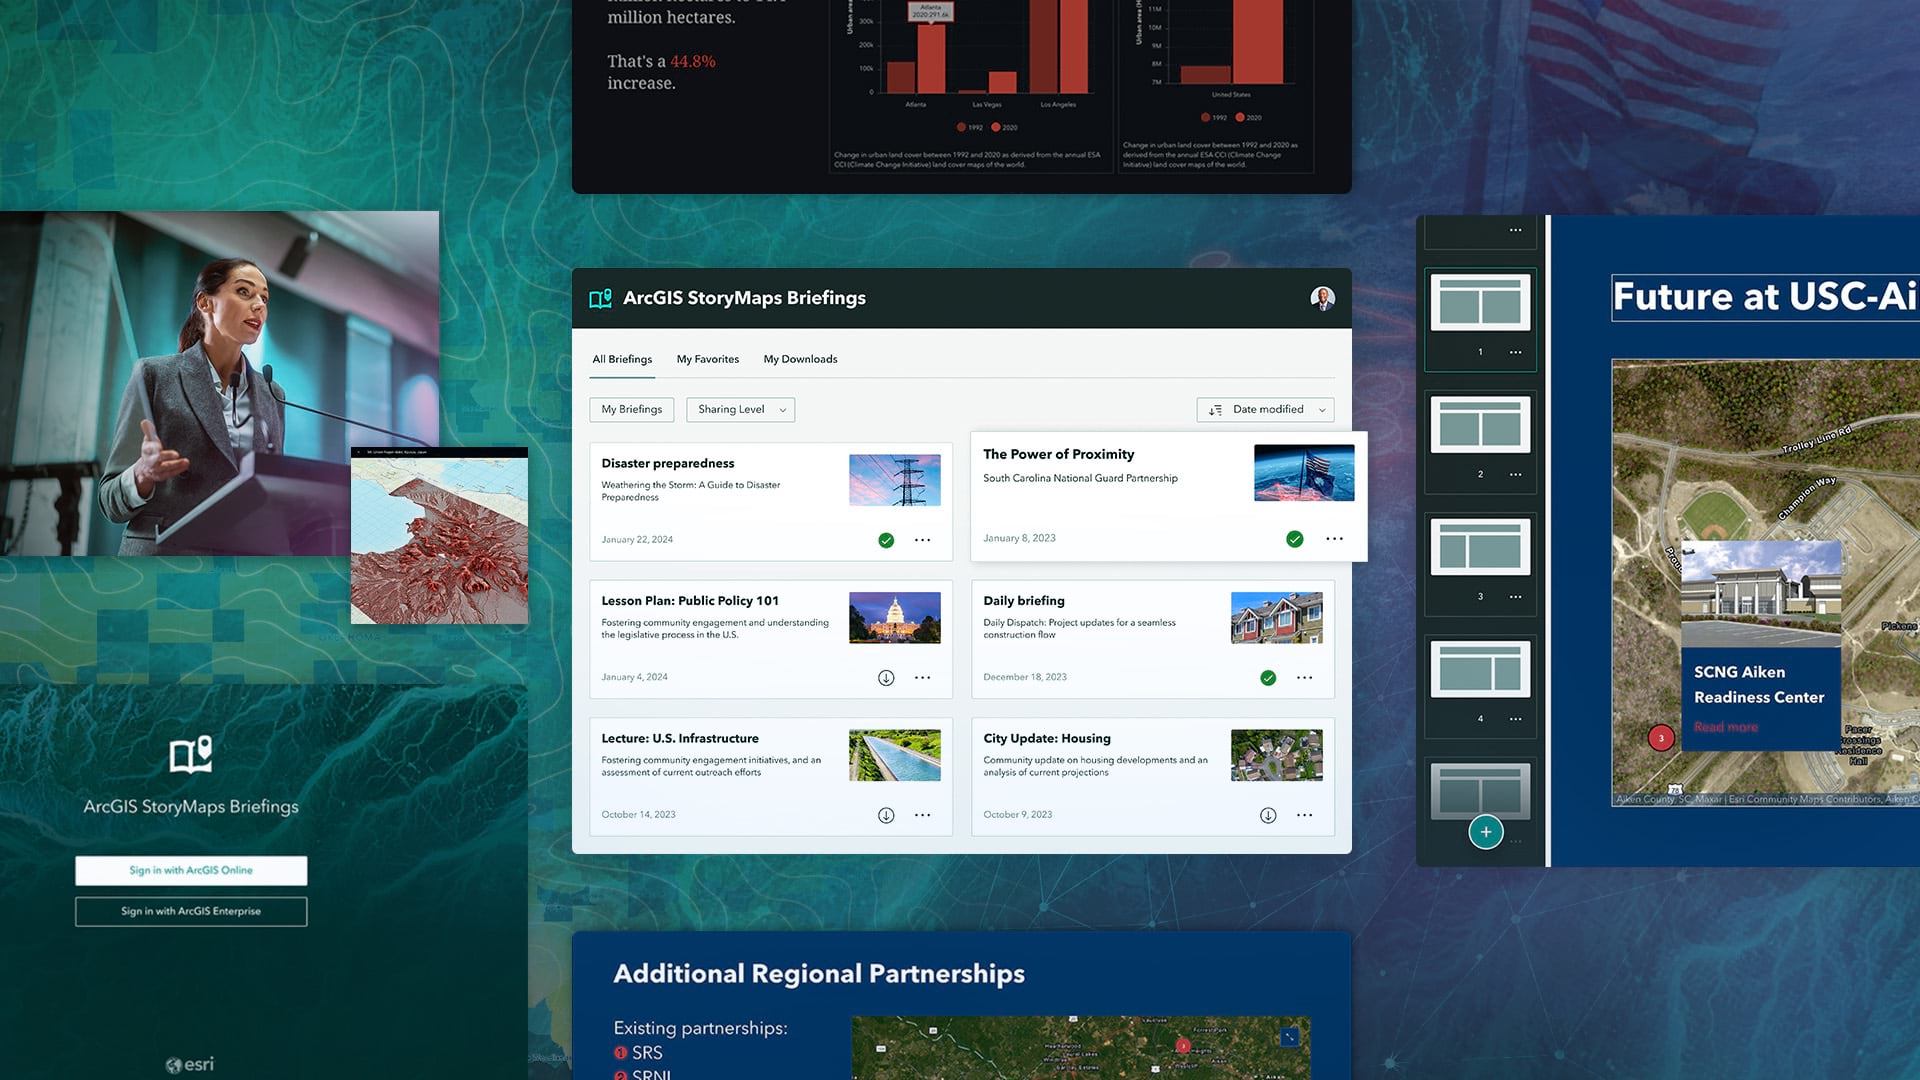
A new StoryMaps output type called briefings helps users create accessible, brand-specific slide-based presentations.
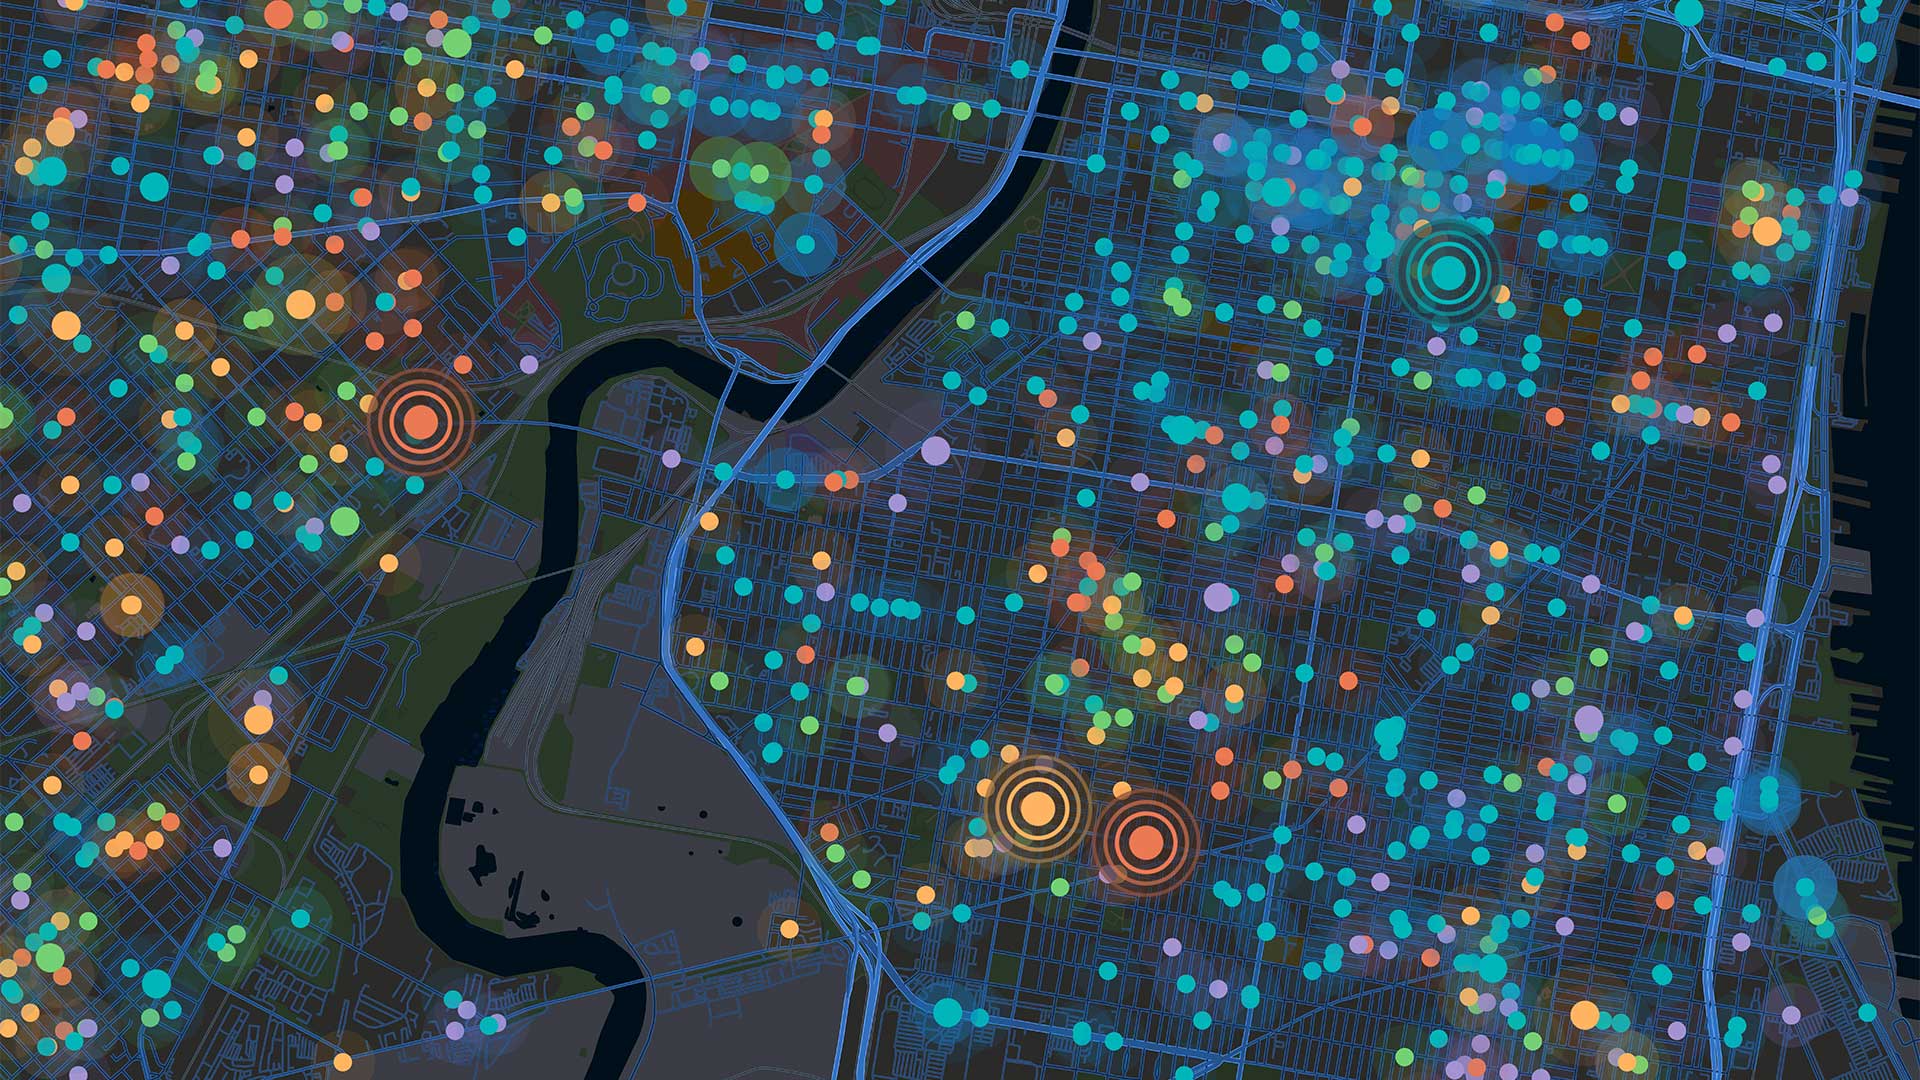
Using Atlas, GIS analysts can create lightweight, interactive web apps around collections of carefully curated geospatial content.
Built on a large language model, the chatbot works like a fast search engine, giving users answers to questions about ArcGIS technology.
An intelligence analyst transforms NYPD’s use of GIS technology, empowering colleagues to enhance investigations and operations.
When presenting data to various groups, it may be a good idea to make different apps for different people. ArcGIS App Builders can help.
When organizations need to tell geospatial stories, standardize processes, or implement new systems, Esri partners make those jobs easier.
The movement gains momentum from in-person events, so activists started using ArcGIS StoryMaps in response to the COVID-19 pandemic.
Recent updates to the app make it easier to design more sophisticated forms and make the data collection experience more efficient.
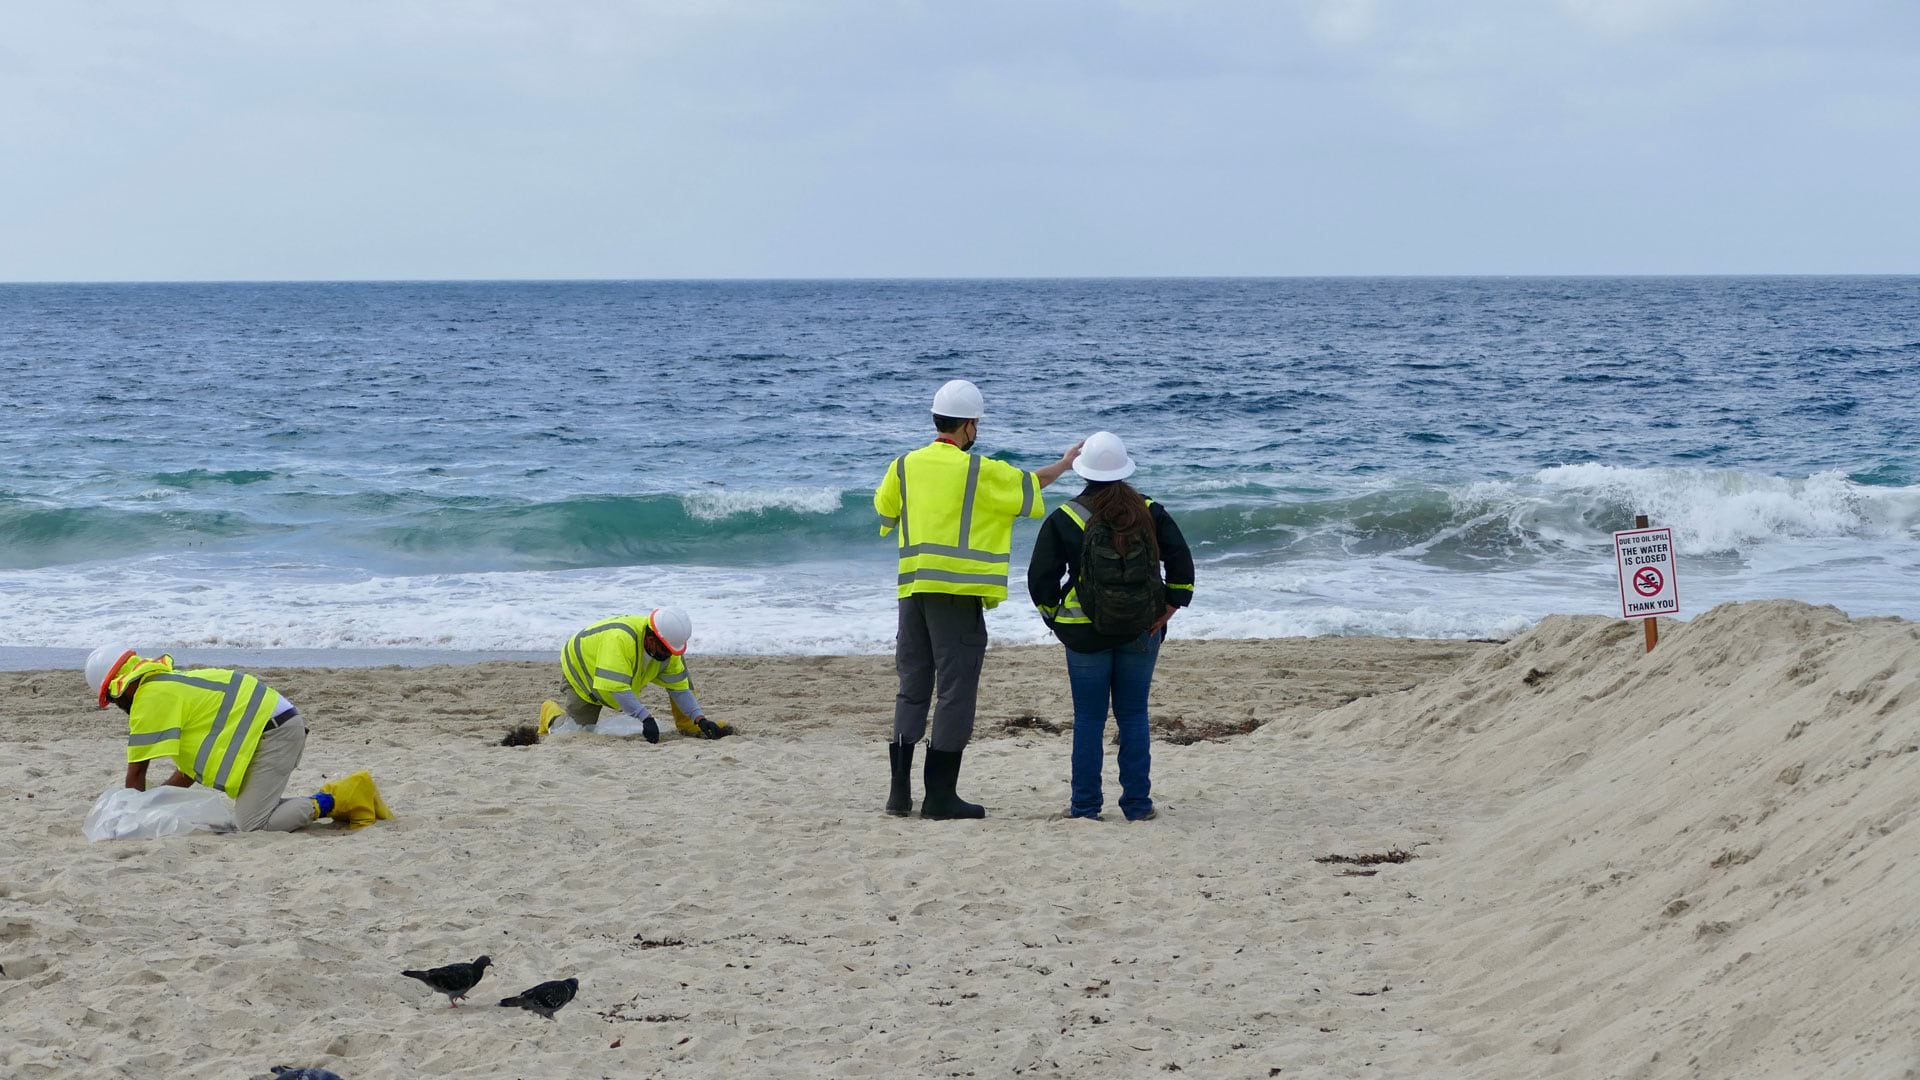
After 25,000 gallons of crude oil spewed into the Pacific Ocean, the Surfrider Foundation leveraged location to streamline data collection.