In Memphis, Tennessee, the Community Redevelopment Agency (CRA) works with local organizations, residents, and businesses to address blight and provide affordable housing. Using the Tax Increment Financing (TIF) tool, the CRA identifies underdeveloped areas that are ripe for improvement and calculates how much funding the projects can obtain based on future expected tax revenue. Projects that the CRA works on include single-family rehabilitation, which provides up to $30,000 in home improvement funds to homeowners in need of assistance, and targeted infrastructure improvement in high-crime areas, which focuses on lowering crime by removing weeds, cleaning up graffiti, and fixing broken streetlights.
For several years, the CRA has used GIS on a limited basis to map parcels, analyze appraisal changes, and communicate with the public—essentially, to do quick analysis and data visualization. But recently, one of its big projects, the Uptown TIF District, required a more robust GIS implementation.

The 100-block revitalization effort of this north Memphis neighborhood focuses on several important community anchors, including the downtown Memphis area; St. Jude Children’s Research Hospital; the Memphis medical district; and a number of community centers, historic businesses, schools, and parks. The idea is to use the $95 million allocated to the project by TIF over the next 10 years to strengthen these anchors so they have the greatest impact on the community, resulting in a neighborhood revival that gives residents a sense of collective pride, makes them feel safe, and attracts additional investment.
To accomplish this, the CRA needed to streamline its data management, mapping analysis, and visualization capabilities. So it turned to Esri partner Allworld Project Management, a Memphis-based professional services firm, to assemble a powerful suite of cloud-based ArcGIS technology.
For the Uptown TIF District project, the CRA had a very specific vision:
- Promote the area as a great place for residents of various income levels and ages to live
- Protect already-existing single-family homes from dilapidation and gentrification
- Preserve and create vibrant community anchors that strengthen residents’ connections to one another and make it easier to get to nearby downtown
To prioritize and manage the projects that would be key to this revitalization effort—including handling Crime Prevention Through Environmental Design (CPTED) data and tracking blight removal, housing rehabilitation, and infrastructure improvements—Allworld configured a series of GIS solutions. Most of them were built in ArcGIS Online and included apps configured using ArcGIS Web AppBuilder, ArcGIS Survey123 forms, a custom configuration of ArcGIS Collector, and dashboards built with ArcGIS Dashboards.
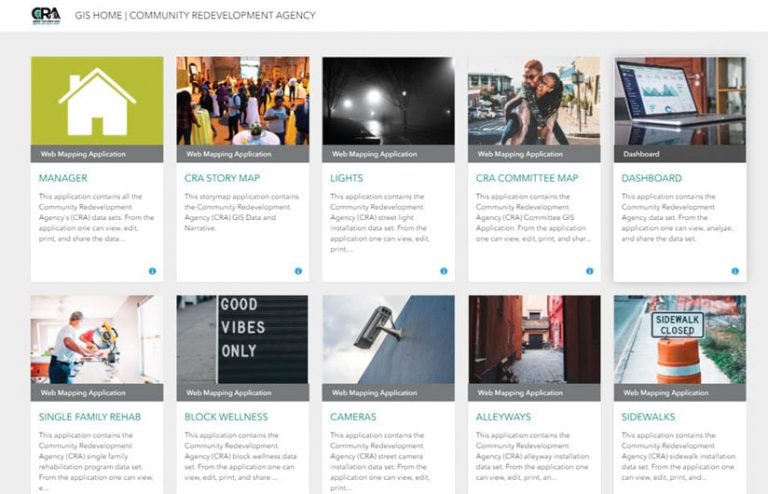
For example, CRA staff members are able to use the Community Redevelopment Manager app, created with Web AppBuilder, to record new data about ongoing projects, such as their status and cost, and edit existing entries. It also enables staff to perform quick, exploratory, and inferential analysis on where to implement changes and invest funds. Using a new business analysis widget linked to Esri Tapestry Segmentation data, the app allows staff members to dig into background and up-to-date information about specific neighborhoods. And Allworld built another, similar app for the Uptown Advisory Committee—which is made up of community members—to show much of the same content, just without the editing capabilities available to CRA staff.

The ease of use of ArcGIS Online, coupled with web-based apps, makes it easy for other stakeholders, in addition to the CRA, to communicate and visualize data as well. For instance, city officials employ the Community Redevelopment Manager web app to collect data on infrastructure projects, such as sidewalk, alleyway, and camera installations, so they can keep track of who is doing what project, how much it’s costing, its status, and more. City officials also use the Block Wellness app to monitor the removal of environmental factors, like weeds, graffiti, and broken streetlights, that contribute to crime.
The same feature services that Allworld used to create the Community Redevelopment Manager app were also used to build a Survey123 app that the CRA can employ in the field to keep tabs on project inspections. Another option (though the CRA didn’t choose this) would have been to use ArcGIS Workforce coupled with Collector or Survey123—or even Collector by itself—to manage field crews and conduct project inspections. The versatility of employing a feature service paired with ArcGIS apps is extremely helpful when trying to meet end-users’ various data collection, management, editing, visualization, and communication needs.
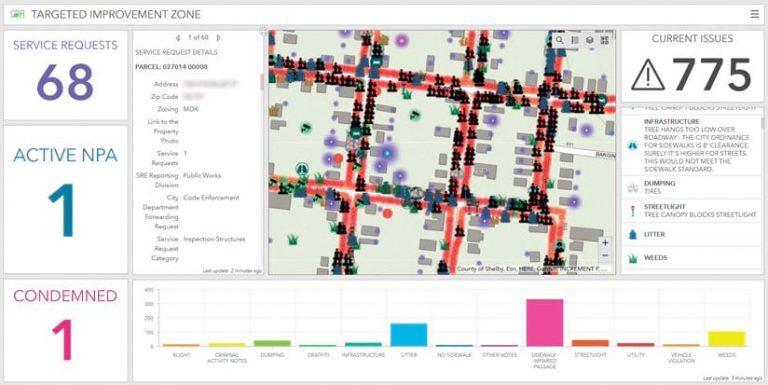
To help key stakeholders with decision-making, Allworld used ArcGIS Dashboards to assemble multiple dashboards that provide a quick, focused understanding of real-time project data. The dashboards, which feature simple visual formats such as maps and charts, include macro views of project statuses and costs, as well as descriptive data—from who owns the land to what kinds of improvements are needed.
Because ArcGIS Online is secure and makes it easy to duplicate apps, the team at Allworld was able to build one set of internal solutions that it employed to manage the project, while the CRA and the Uptown Advisory Committee rely on their own set of solutions to carry out redevelopment operations. Given that all these solutions were tied to the same datasets via cloud-based storage in ArcGIS Online, everyone was working from the same data. This has saved the CRA time in determining which areas in the Uptown TIF District to target for revitalization, which, ultimately, has helped everyone involved streamline funding.


