Real-Time GIS Helps Monitor Pollutants to Meet Country’s Growing Needs
Kuwait is hot and dry. Located on the Arabian Peninsula, this desert country lacks freshwater resources. It does have access to saline sea- and groundwater, though. Thus, Kuwait is a leader in desalination, having purchased and installed six desalination plants—all of which it continues to operate and maintain.
To ensure that water supplies meet Kuwait’s growing needs, the government established a specialized center to research the current and anticipated demands on water resources. The Water Resources Development Center (WRDC), which now resides in the Ministry of Electricity and Water, relies heavily on GIS to study water development and conservation and assess problems that have affected or could impact the country’s water system.

One of WRDC’s tasks is to monitor water quality in Kuwait. The country is developing quickly. As of 2014, its population was 3.75 million with an estimated population growth of 4.3 percent, according to the World Bank. And the five-year Kuwait Development Plan, currently in the works, seeks to make the country a trade and financial hub in the region by 2035, so infrastructure projects abound.
WRDC’s water surveillance has to be precise and expansive, beginning with the desalination process and extending all the way until the water is distributed to consumers. To keep all its field operations in order, WRDC uses the ArcGIS platform extensively.
Setting Standards for Monitoring Water Pollution
Water can convey bacteria and substances that lead to diseases such as cholera and dysentery, along with other serious health problems. Monitoring waterborne pollutants is imperative.
When the government created WRDC, it also established two labs—a bacteriological one and a chemical one—as part of the center to check water samples regularly for these kinds of pollutants. The first of their kind, the labs put in place standard operating procedures for dealing with cases of water contamination.
Desalination by itself does not yield ready-to-use water. The process removes both harmful and beneficial substances from water, so the desalinated water must be infused with chlorine (Cl2) and sodium hydroxide (NaOH), for example, before it can be delivered to customers. Additionally, many other factors, such as damaged or old pipes, can affect the water as it makes its way to distribution points and, ultimately, the public.
The sample collectors from the bacteriological and chemical labs need to be able to follow the water’s flow from the desalination plant to the distribution point. For that reason, staff determined that sampling points should be located as closely as possible to the main lines that carry drinking water from pumping station sites and reservoirs to the sector mains, which typically supply water to several distribution zones and district metered areas.
The labs also figured out that the number of sample points should reflect the population density of each area, since more consumers in one place means more water flows through that network. So WRDC determined that an area with a population of 20,000–50,000 should be sampled every two weeks, for example, while an area with 50,000–100,000 people should be sampled every four days.
Together—and implementing standards like these—WRDC’s bacteriological and chemical labs ensure that Kuwait’s drinking water is up to international standards.
More Efficient, Comprehensive Data Collection
The lab teams—each consisting of a lab technician, a sample collector, and a driver—gather water samples from more than 700 locations as often as the areas’ population sizes prescribe. The samples are tested in the field for residual chlorine, pH levels, conductivity (the ability of water to conduct an electric current), temperature, total dissolved solids (TDS), and chlorine dioxide (ClO2). The results of these tests must comply with local and international organizations’ water quality standards—especially those of the World Health Organization.
To help easily ensure this adherence, WRDC employs ArcGIS when it conducts field tests. Using this software reduces the amount of time-consuming paperwork that the lab teams have to do and cuts down on data entry mistakes. It also allows for more unified and comprehensive data—especially given that sample collectors can attach images and videos to their data.
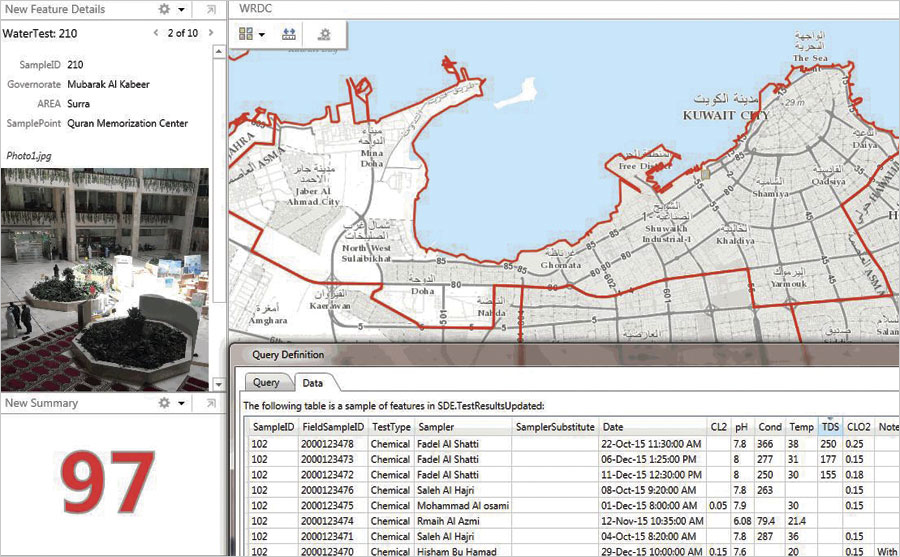
WRDC used ArcGIS for Desktop to create a map for collecting water sample locations and test results. It then published the map to ArcGIS for Server as a feature service, added it as an item to Portal for ArcGIS, and made it accessible through the Collector for ArcGIS app. The lab technicians and sample collectors could then use the map to record the water quality tests while still in the field. Additionally, since it is difficult for teams to memorize the exact locations of their many sample points, the ministry used the ArcGIS Network Analyst extension to develop a routing service for Kuwait’s street networks, which WRDC field teams also use in Collector.
To make data entry as straightforward and accurate as possible, WRDC created drop-down menus for the Collector map to help the lab teams filter the 700 sample locations by governorate, neighborhood, block, and location type (according to Kuwait’s administrative divisions). WRDC also created domains that show the test type (bacterial or chemical) and the names of the lab technicians who perform the field tests. Setting these up as domains, or lists, makes it easy for field staff to filter these choices on the go. Additionally, the Collector app lets lab teams record the time at which a test is taken, since Kuwait’s hot midday temperatures can affect test results.
The completed results are kept in a table that displays relationships in a one-to-many format, which makes it easier to monitor trends over time at the sample sites. For example, if a sample site is tested for pH once a month over the course of a year, those 12 test results can be displayed as a line chart to see how the pH levels tend to change. Being able to attach photos and videos of the sample points also lets WRDC staff monitor their conditions over time.
Working with Real-Time Results
To attain an International Organization for Standardization (ISO) certification in water quality, WRDC needed to have the ability to track the data collection process in real time. The organization uses Operations Dashboard for ArcGIS to check the submitted sample results right away. Not only does this help pinpoint problems more quickly, but it also demonstrates that field technicians get to the correct testing point and follow specific procedures when conducting field tests.
Additionally, when a lab team submits the Collector form with test results, the information automatically gets uploaded into the database—which makes it easy for a GIS operator at WRDC to update the map in ArcGIS for Desktop and generate reports. The information shown in these reports varies and can include details on the progress of each team, the number of samples taken in a specific area, and which specific tests are conducted over time. In most cases, these reports are displayed to WRDC managers as charts and maps, which allow them to easily absorb the information and make quick, informed decisions.
Implementing the ArcGIS platform has certainly made WRDC’s work a lot easier—and smarter.

