Helping Users Do Their Work
These four articles describe how Esri partners are helping users with innovative solutions and comprehensive services. They illustrate capabilities that range from managing assets and facilitating data sharing to helping with GIS upgrades and setting up cloud infrastructure. The companies that make up the Esri Partner Network can help organizations get the most out of data and take full advantage of the innovations they have made in Esri technology.
County in Florida Recoups Millions After Natural Disasters
Bay County, located on the coast of the Florida Panhandle, is prone to flooding from hurricanes, tropical storms, and surging rainfall. For many years, the county’s Public Works Department didn’t have clear insight into how it was spending its time or what condition its assets were in.
“We were relying on paper and maps and a lot of memories to manage our infrastructure,” said the county’s public works director Keith Bryant. “The challenge is, when you lose employees, you lose that historical maintenance information. So we needed a way to record our data.”
The problem became especially apparent when Bay County had to assess damage and repair costs on its assets after natural disasters. It would take weeks, or even months, for the county to compile damage assessment information into reports to send to the Federal Emergency Management Agency (FEMA). The team often felt that it was leaving money on the table.

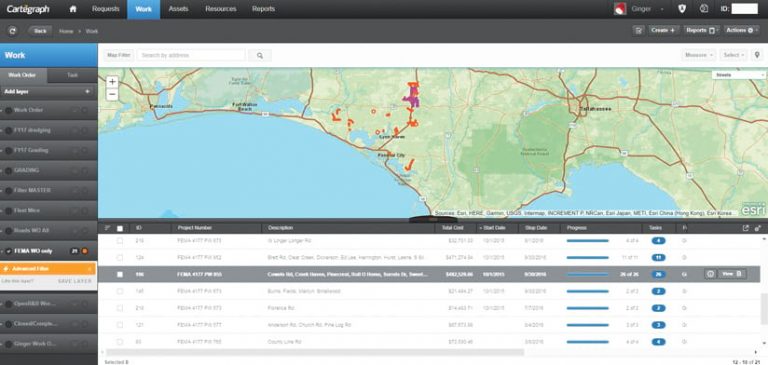
The Bay County Public Works Department turned to Cartegraph to implement a system that could fix these problems. By integrating the mapping capabilities of ArcGIS with Cartegraph’s operations management system, Bay County was able to start managing its infrastructure in one centralized, real-time database.
Public works team members now assign an overall condition index (OCI) to each asset. Those OCI data points enable them to generate automatic work orders so they can do more repairs proactively. The system has eliminated stacks of slow-moving paper work.
In addition, the Public Works Department uses ArcGIS Enterprise and Cartegraph to track maintenance costs down to the penny. This means that when disaster strikes, the team members can compile FEMA reports with ease and recoup millions of taxpayer dollars.
“When we have these major flood events, we’re able to go and show FEMA exactly what we did: we had this many people respond with this equipment, it took us this long, and this is what it cost us,” said Bryant. “And we can just hit Print and give the data to FEMA. It’s that easy. That’s millions of dollars back to the county, and we couldn’t do that without Cartegraph.”
San Diego City and County Streamline Data Maintenance and Sharing
To optimize efforts and resources, the City of San Diego and the County of San Diego in California share a GIS landbase and data warehouse, which are managed and maintained by the San Diego Geographic Information Source (SanGIS). This arrangement, called a Joint Powers Authority (JPA), allows the two separate government organizations to combine resources to meet common objectives—in this case, sharing data and providing up-to-date information to the public.

For SanGIS, its mission is to maintain and promote the use of GIS data for landbase maintenance, data warehouse management, and public access to GIS data. To achieve those goals, SanGIS partnered with Quartic Solutions to implement the Esri Geospatial Cloud by setting up ArcGIS Enterprise on Amazon Web Services (AWS).
Once this environment was established, SanGIS used it to publish regional imagery, gathered by third-party vendors, that the City and County of San Diego—as well as the public at large—could consume and use for basemaps, code enforcement, planning, and other endeavors. This saves these agencies and other organizations the cost and effort associated with hosting the data themselves.
SanGIS also uses the Esri Geospatial Cloud to create and maintain San Diego County Assessor map books. Previously, two different organizations did data entry: the County of San Diego Assessor’s Office entered parcel data in CAD first, and then SanGIS reentered that data into its GIS and added lot data. This resulted in data duplicates. But with ArcGIS Enterprise on AWS, each organization now enters its data directly into the GIS, eliminating duplicate entries and enabling the data to be published much faster than in the past. The operating costs associated with creating and maintaining the map books have been reduced as well.
Centralizing these workflows required moving the maintenance of a number of mapping activities from CAD to ArcGIS. To accomplish this, Quartic Solutions created custom GIS edit, report, and publication tools to mimic the CAD system’s functionality, as well as its product outputs. Now, the City of San Diego and the County of San Diego can reliably send data back and forth, which also saves time. In the future, the county assessor plans to expand this system to include other types of updates for the landbase. This versatility has allowed SanGIS to use a single solution to meet two goals: data sharing and collaborative database maintenance.
Waste Services Company in Canada Stays Up-to-Date with ArcGIS
Canadian waste services company GFL Environmental Inc. leverages GIS to streamline all areas of its commercial business, from waste management to infrastructure development. To stay on top of Esri offerings and keep the ArcGIS platform at the core of its operations and workflows, GFL Environmental has partnered with GISinc for nearly a decade, taking advantage of many of its premier GIS services.
For example, GISinc worked on capacity planning and architecture design for GFL Environmental’s upgrade from ArcGIS Server 10.3.1 to ArcGIS Enterprise 10.5.1. The Esri partner also implemented ArcGIS GeoEvent Server and ArcGIS GeoAnalytics Server for asset tracking and history analysis. Additionally, GISinc assisted with platform configuration, customer development, documentation, and custom training.
GFL Environmental stays up-to-date with GIS technology by making upgrades part of its yearly plan. When the company upgraded to ArcGIS Enterprise 10.6.1, for instance, it leaned on GISinc to plan and execute the upgrade, as well as for script updates and extending the use of ArcGIS Enterprise across the organization. To allow GFL Environmental better visibility into how the system performs, GISinc also set up ArcGIS Monitor.
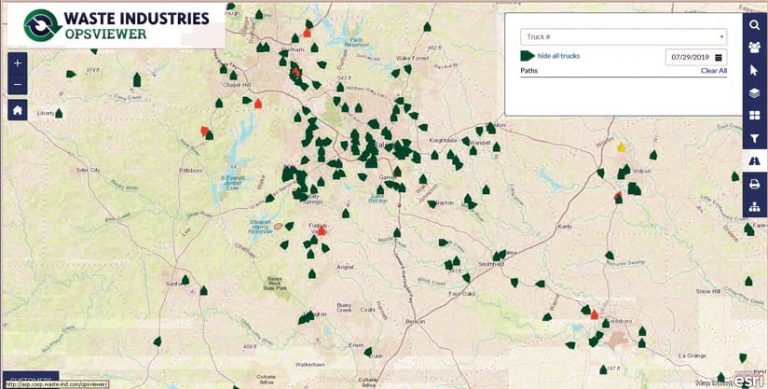
As a result of its partnership with GISinc, several of GFL Environmental’s teams—including marketing, operations, GIS/IT, and leadership—have seen returns on investment in their business areas. Using the Ecommerce Tool that GISinc built, the marketing team is able to bring in higher sales volumes and execute a quicker sales process, all while getting fewer calls to customer service. With OpsViewer, the operations team can see truck locations in real time and the routes that trucks have traveled, while a mobile app shows where clients are located. This ensures that employees can make faster, better-informed decisions in the field, which ultimately saves travel time while maximizing employees’ effectiveness. In addition, leadership now has an overall view of analytics, ensuring that this team can easily identify areas for improvement or potential investment.
Public Safety Organizations Get an Innovative View of Cell Coverage Data
It is critical for public safety agencies to know precisely which mobile carriers have coverage where and how well it works. That’s why Virginia-based technology consulting firm Televate, which specializes in interoperable communications infrastructure, devices, and software, recently developed a coverage collection and analysis service called Pinpoint. It enables users to crowdsource cellular network availability and performance data for various carriers and then see this information on maps and dashboards.
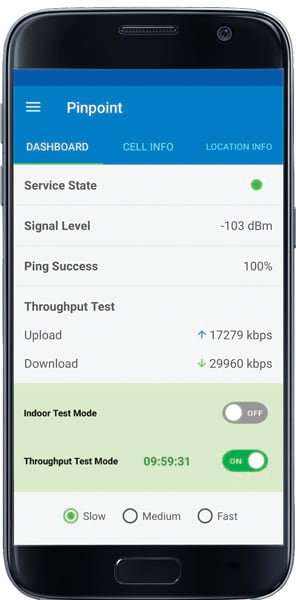
The Pinpoint mobile app collects more than 50 unique data elements, including service availability, ping loss, ping delay, device location, signal strength, signal quality, network latency, and data throughput. The mobile app integrates with Televate’s geospatial cloud service to aggregate and analyze the data and then provide end users with high-quality visualizations of carrier coverage.
Pinpoint relies on Esri technology and a geospatial cloud infrastructure, thanks to Televate’s partnership with GeoMarvel. The Esri partner, based in Washington, DC, builds lasting, scalable GIS infrastructure and software solutions that address its customers’ goals and initiatives.
In Televate’s case, the company wanted to offer comprehensive client-side data visualizations. With GeoMarvel’s help, Televate used ArcGIS Enterprise, ArcGIS API for Python, and ArcPy to geospatially enable Pinpoint on an associated cloud infrastructure built on Amazon Web Services (AWS), including Amazon Elastic Compute Cloud (Amazon EC2), Lambda, CloudFront, API Gateway, and Amazon Relational Database Service (Amazon RDS).
The Pinpoint dashboard contains a great deal of information about the collected data, such as service state, signal level, ping success, and upload/download speeds. Now, public safety agencies can visualize this data all in one place and get a complete view of network carrier coverage.

